a quiet traffic day on the mouth of the Fraser...
Sands Head to Steveston,
Fraser River Mouth
CSL Heron, June 26, 27, 28, 29th, 2022
page version
July 19th 2022

distal river plume front - off Gulf Islands
JD179's edge seen on JD180
a quiet traffic day on the mouth of the Fraser... |
Imaging the
Salt Wedge Sands Head to Steveston, Fraser River Mouth CSL Heron, June 26, 27, 28, 29th, 2022 page version July 19th 2022 |
distal river plume front - off Gulf Islands JD179's edge seen on JD180 |
| John E. Hughes Clarke Center for Coastal and Ocean Mapping University of New Hampshire |
Graham Christie Ocean Mapping Group University of New Brunswick |
Mathew Wells Dept. Physical and Environmental Sciences University of Toronto |
Phillip Hill Pacific Geoscience Centre Natural Resource Canada |


| Epoch and tidal phase |
EM712 view (70-100 kHz) -----
EM2040C view (250-350 kHz) ---- ADCP view (600 kHz) |
JUNE 26th |
|
JD 177 A |
 late on flood tide - salt wedge at bend, dropping into scour depression |
JUNE 27th. |
|
JD178 A |
 late of ebb tide - salt wedge being pushed back toward Sand Heads surface outflow at 5-6 knots! highest suspended sediment levels ever seen occur just upstream of nose of wedge. |
JD178 B |
 just after LW - salt wedge arrested just below Sand Heads highest suspended sediment levels where freshwater outflow is able to shear directly against the seabed. |
JD 178 C |
 just after LW - salt wedge now starting to move upstream, out of scour hole by Sand Heads |
JD 178 D |
 mis flood tide - salt wedge halfway up reach and advancing |
JD 178 E |
 late on rising tide - salt wedge advancing up toward the bend. |
JUNE 28th |
|
JD 179 A |
 late on falling tide - salt wedge being dragged back down the reach. surface outflow at ~ 5 knots. |
| across mouth section A performed now. | |
JD 179 B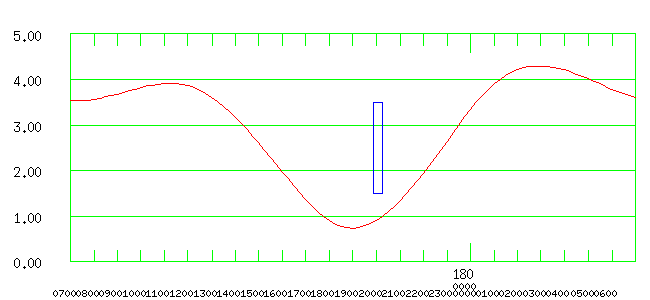 |
 just after low water - salt wedge sitting below Sand Heads in the scour hole highest suspended sediment levels are in the all fresh water region - but notably less than the previous day (?). |
JD 179 C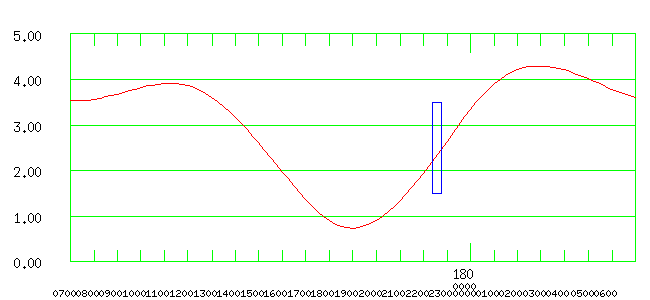 |
 mid flood tide - salt wedge finally advancing again. |
| across mouth section B performed now. | |
JD 179 D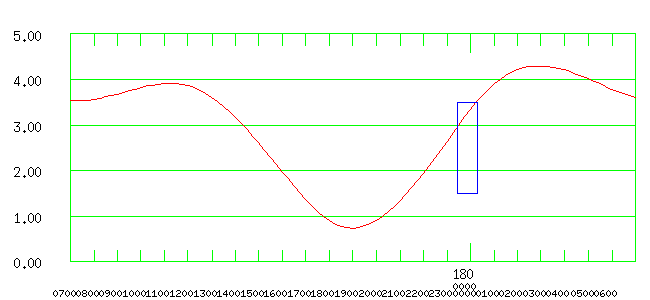 |
 late on rising tide - salt wedge moving back up the channel toward the bend. |
JUNE 29th |
|
JD 180 A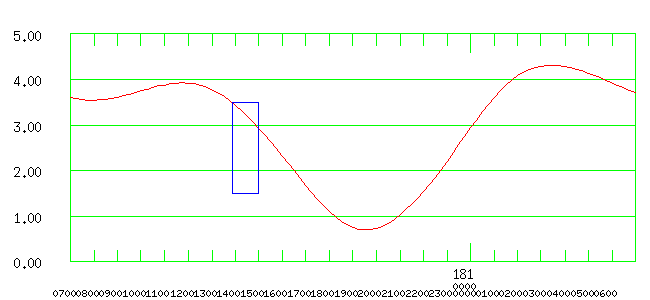 |
 earliest phase of tide sampled - ~ 1 hour after HW - maximum salt wedge penetration - well past Steveston |
|
data presented:
Tidal Phase Map View ADCP on/off delta velocities EM2040 WCD with Salinity with OBS EM712 WCD |
JD 177 A |
JD 178 A |
JD 178 B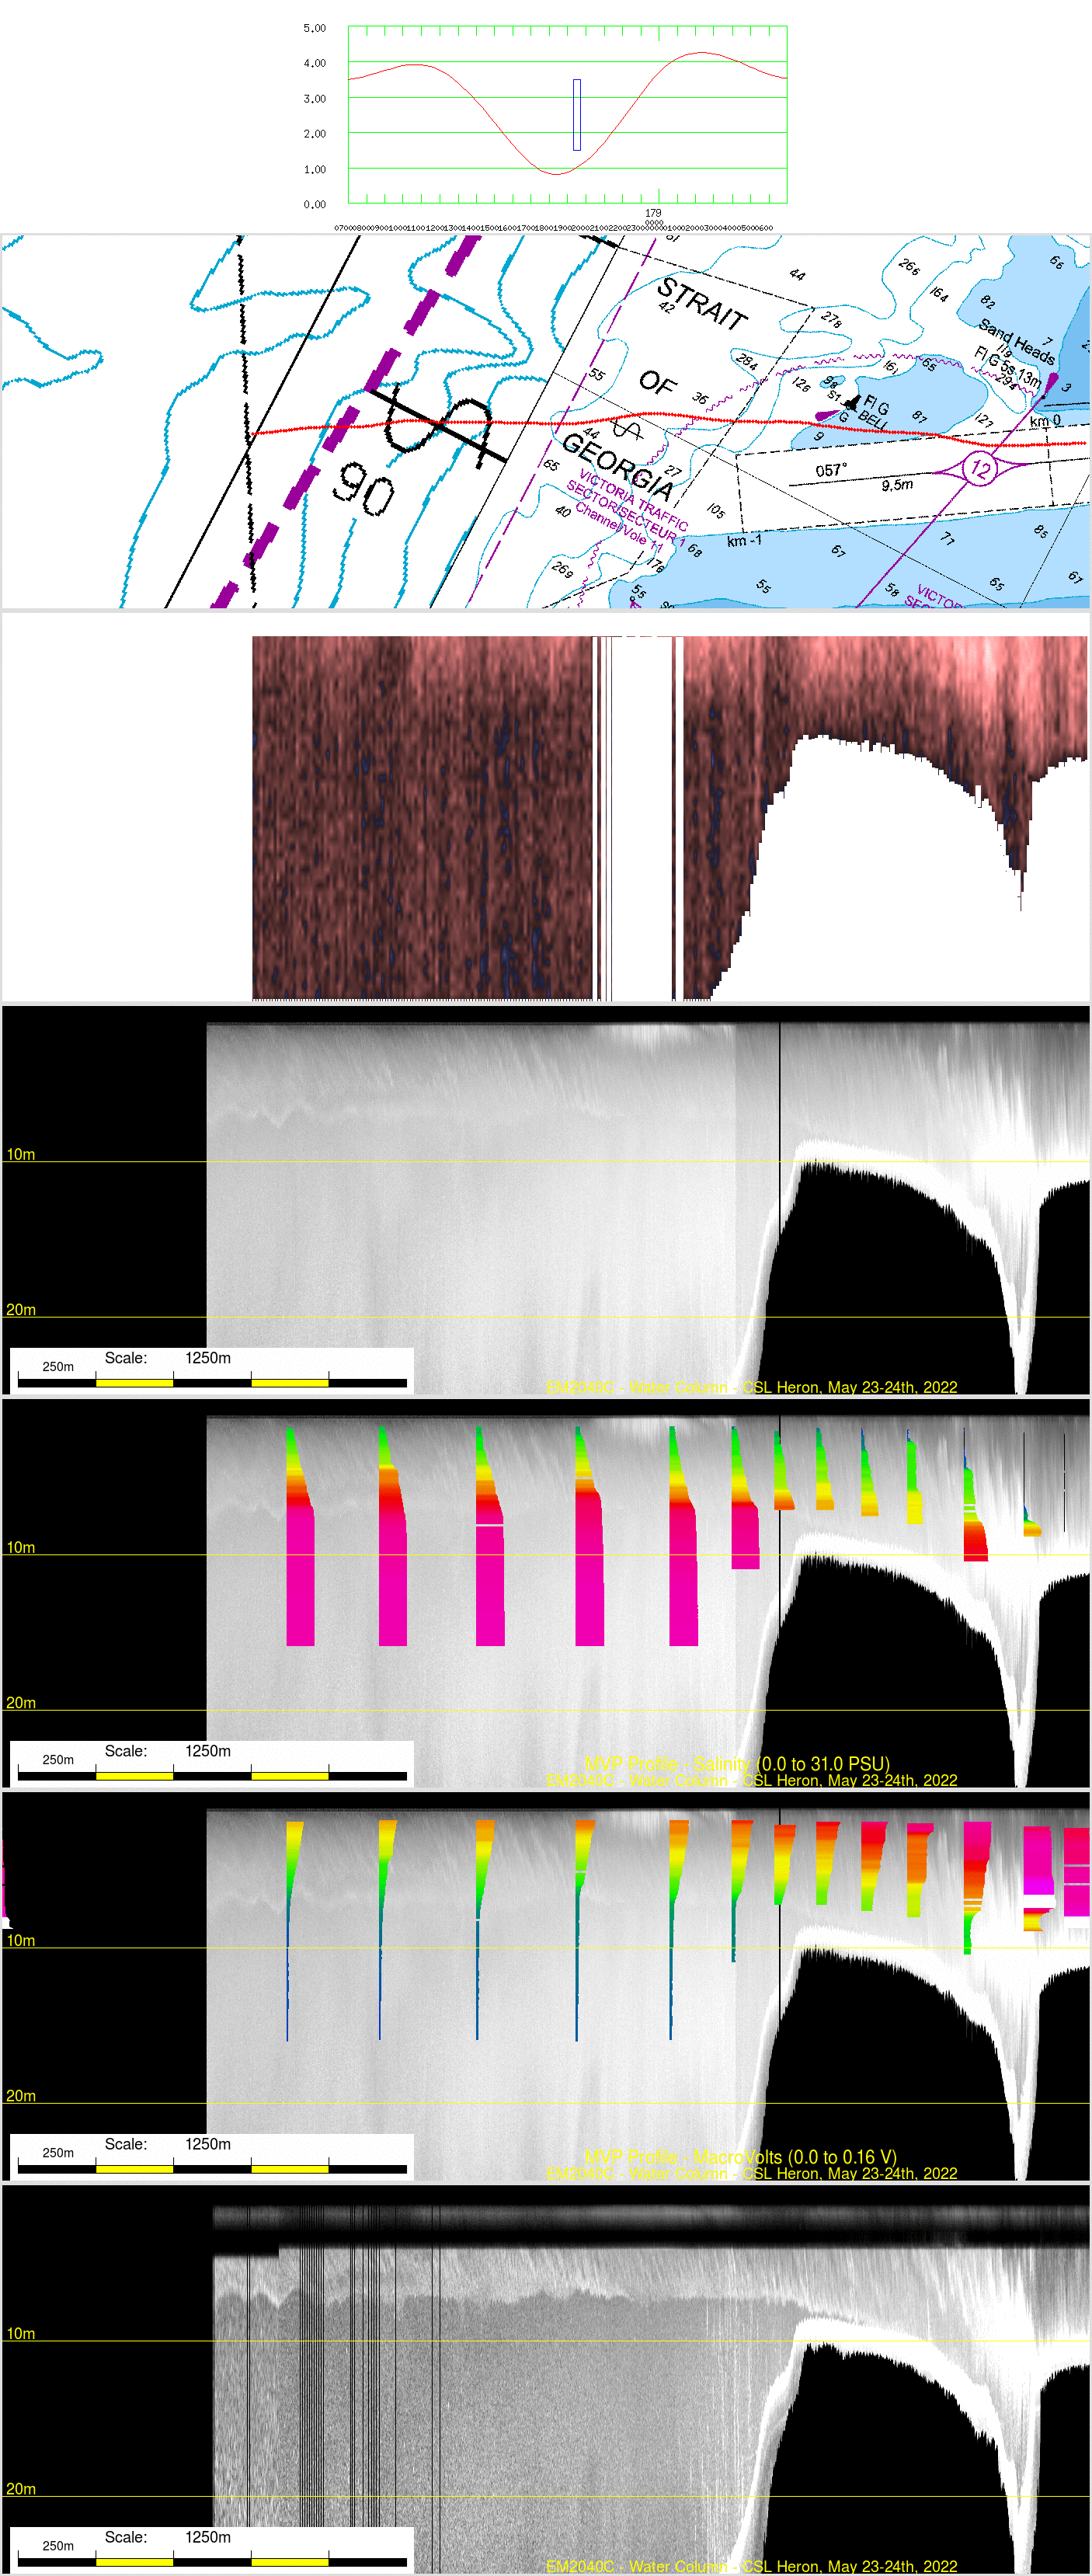 |
JD 178 C |
JD 178 D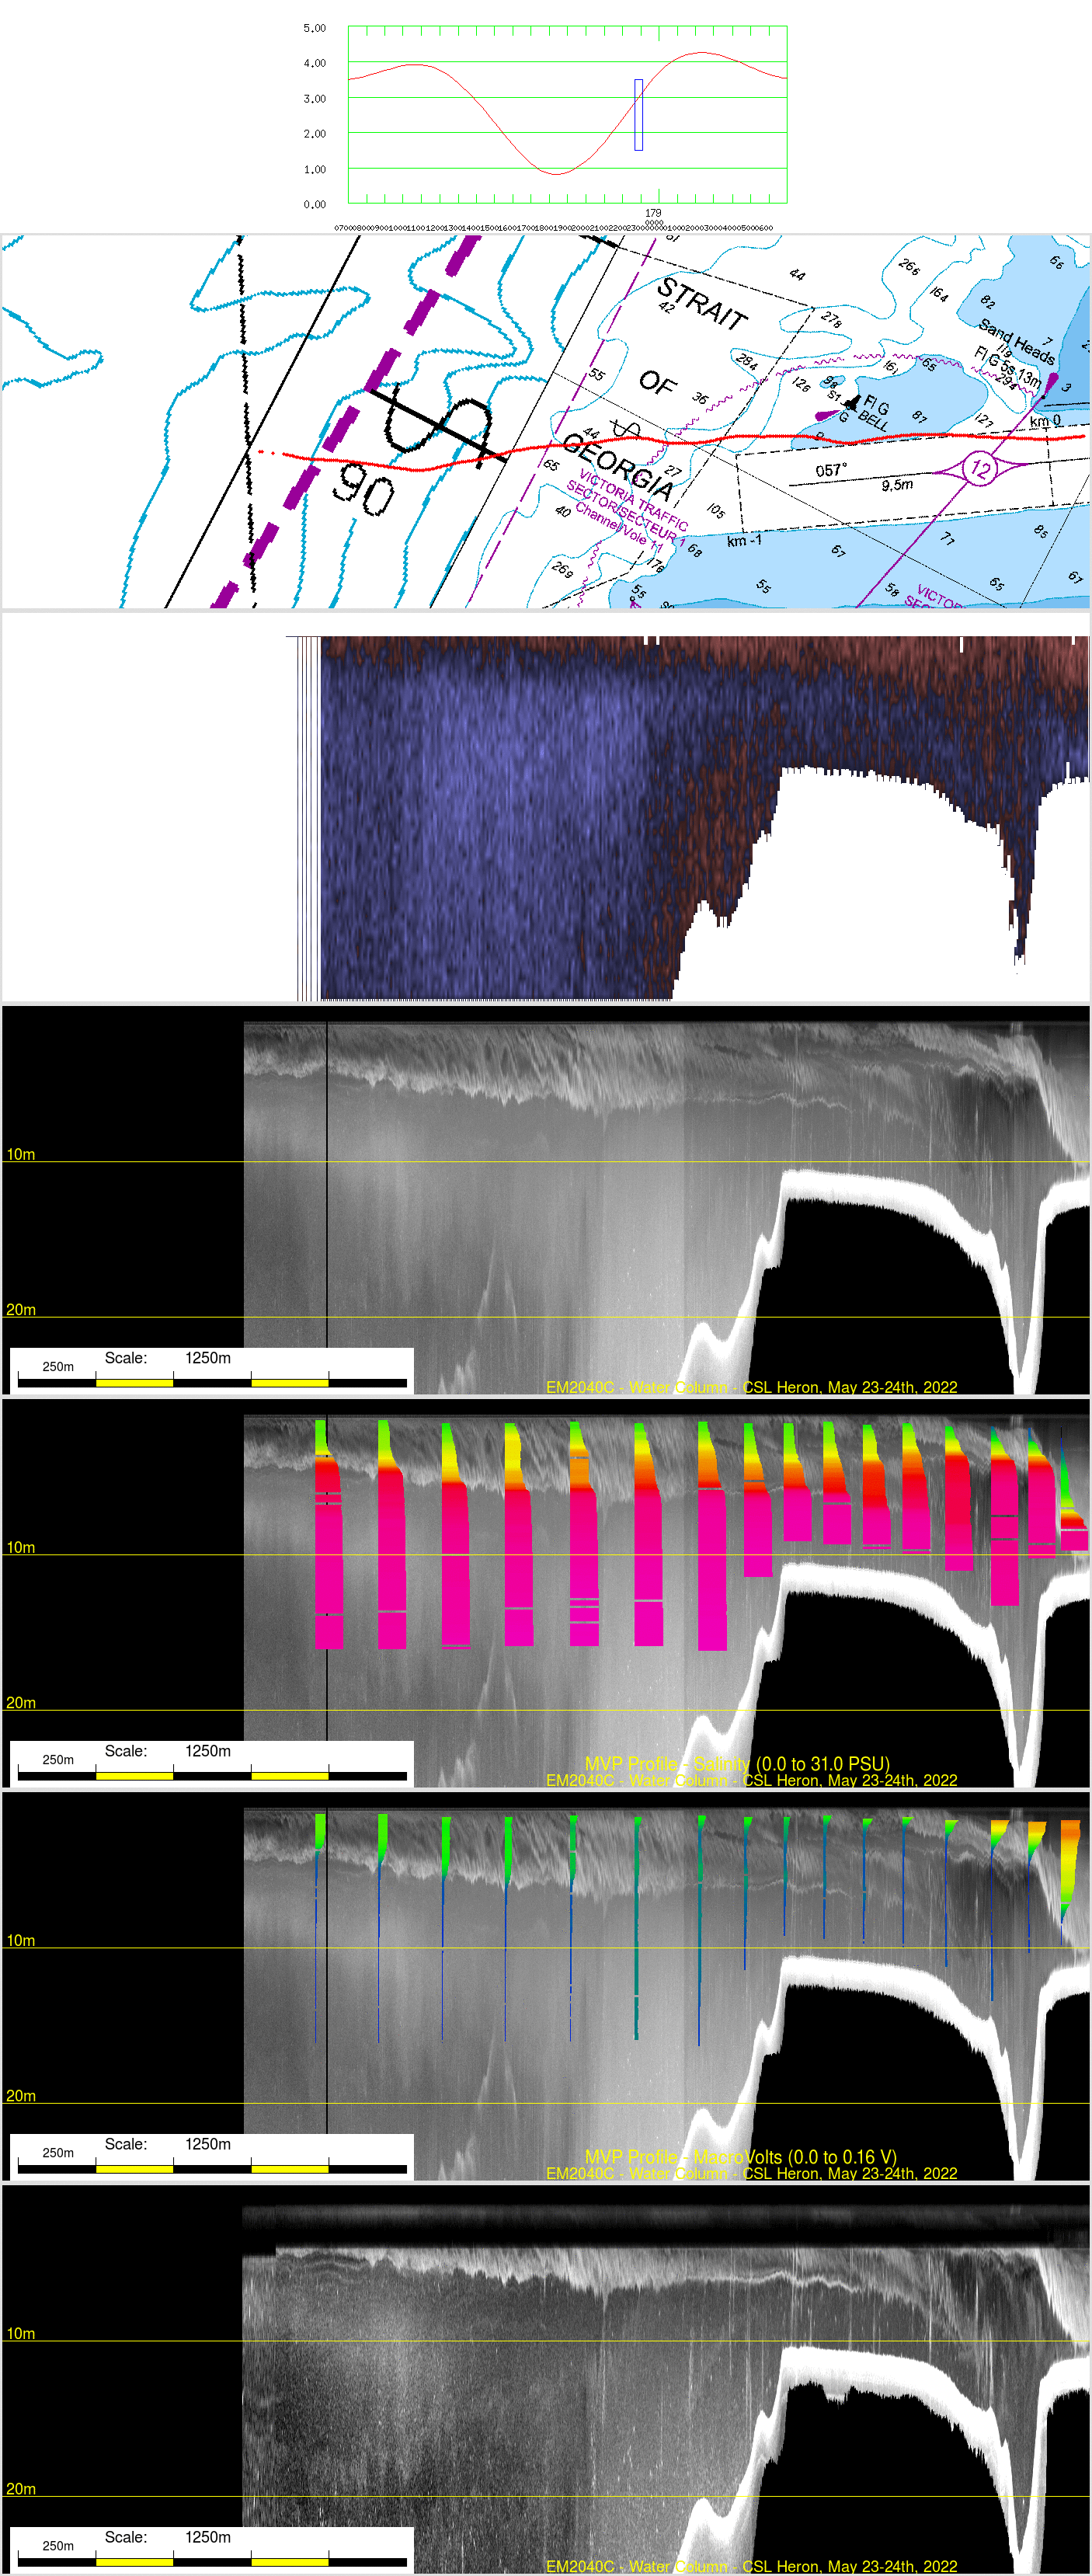 |
JD 178 E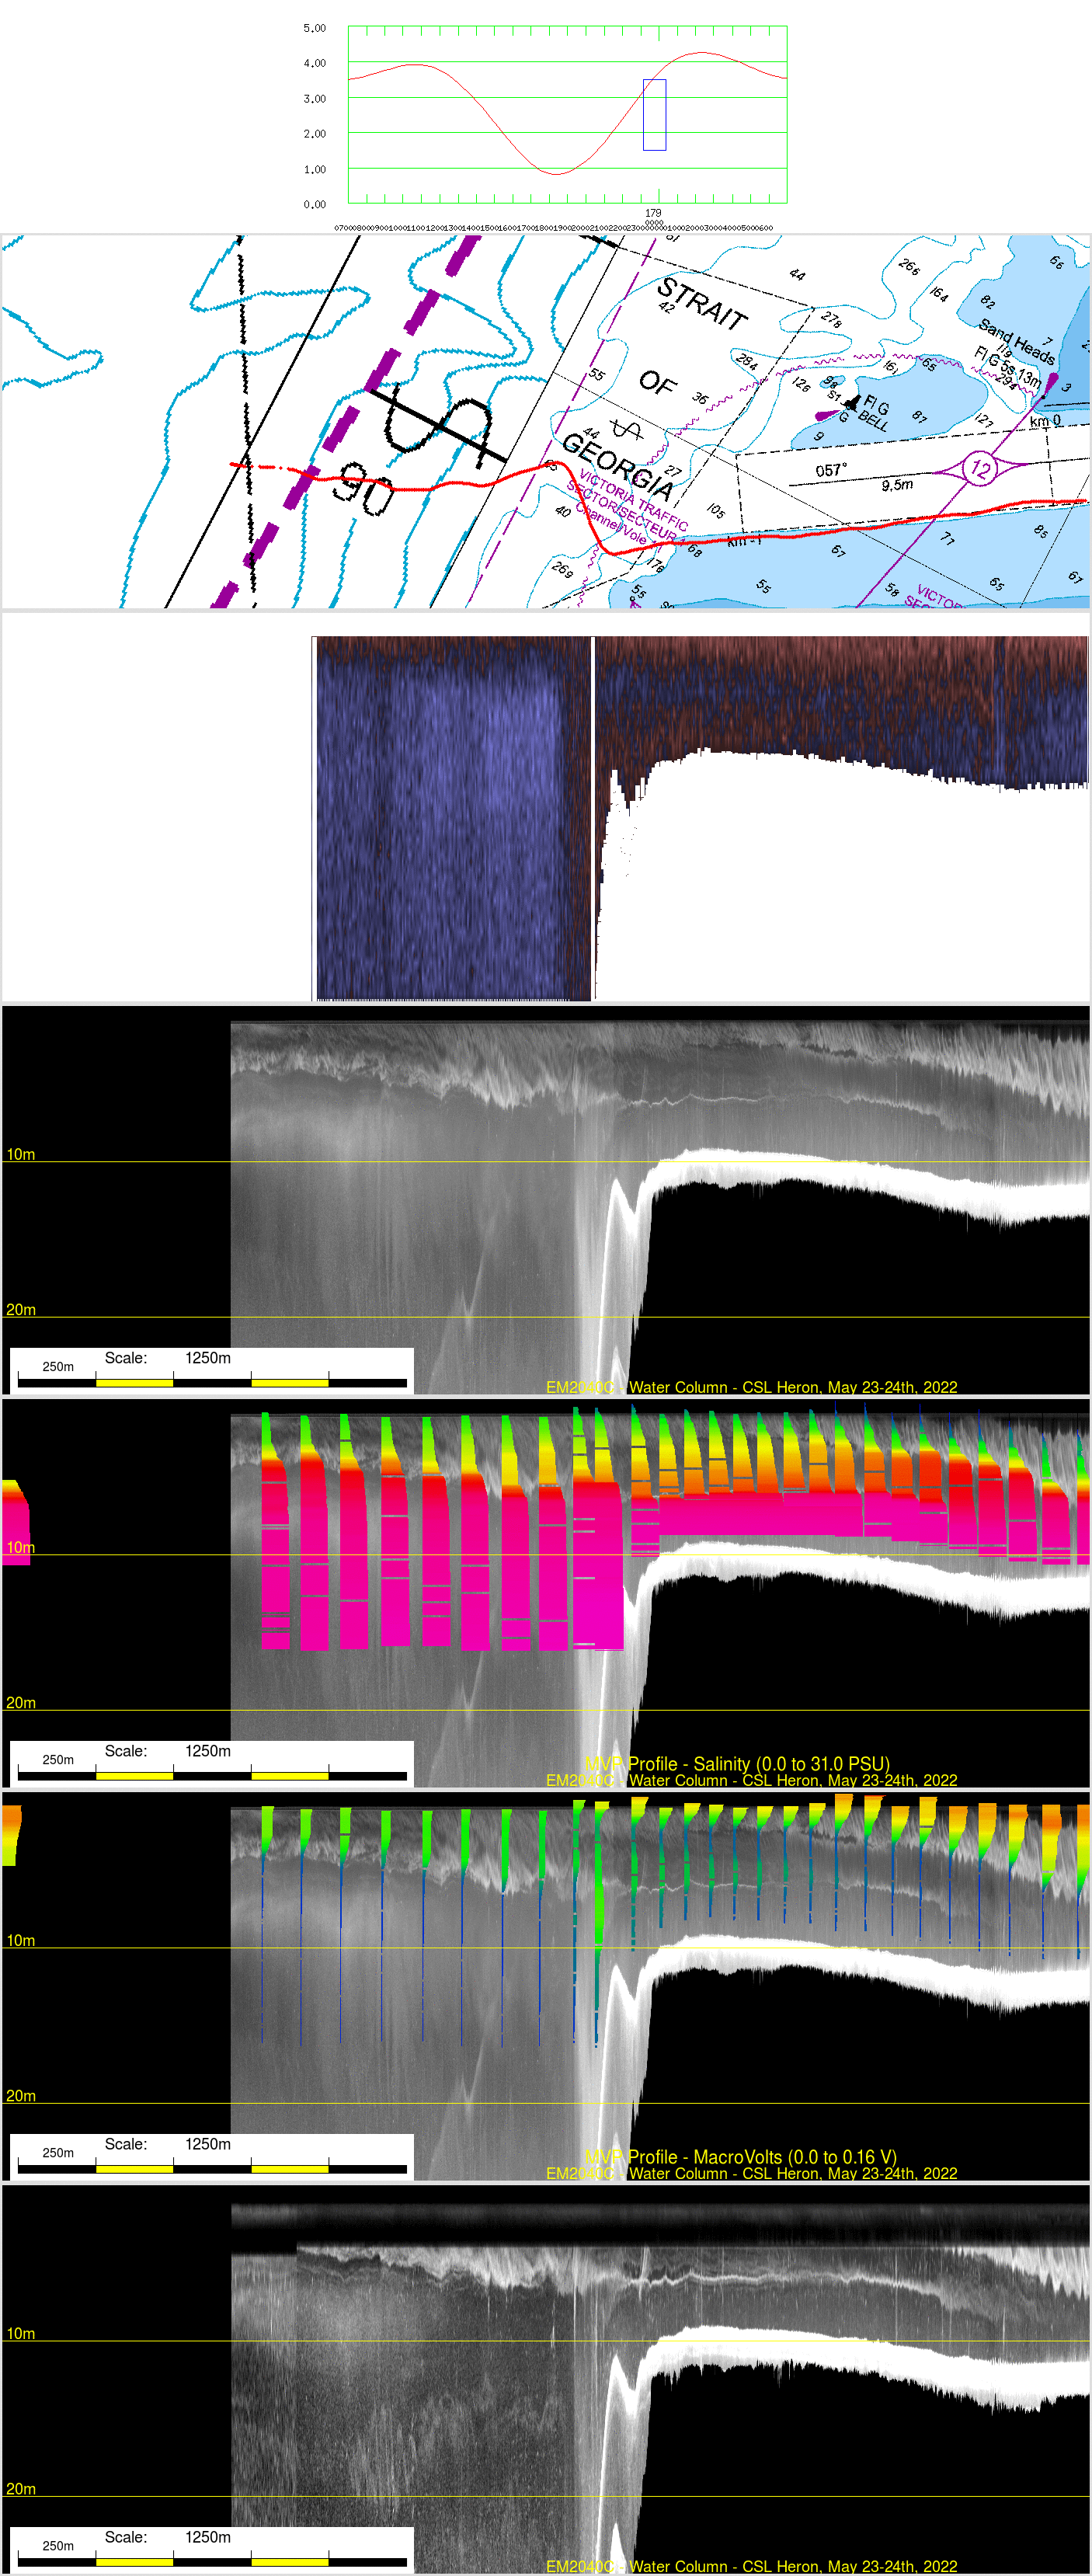 |
JD 179 A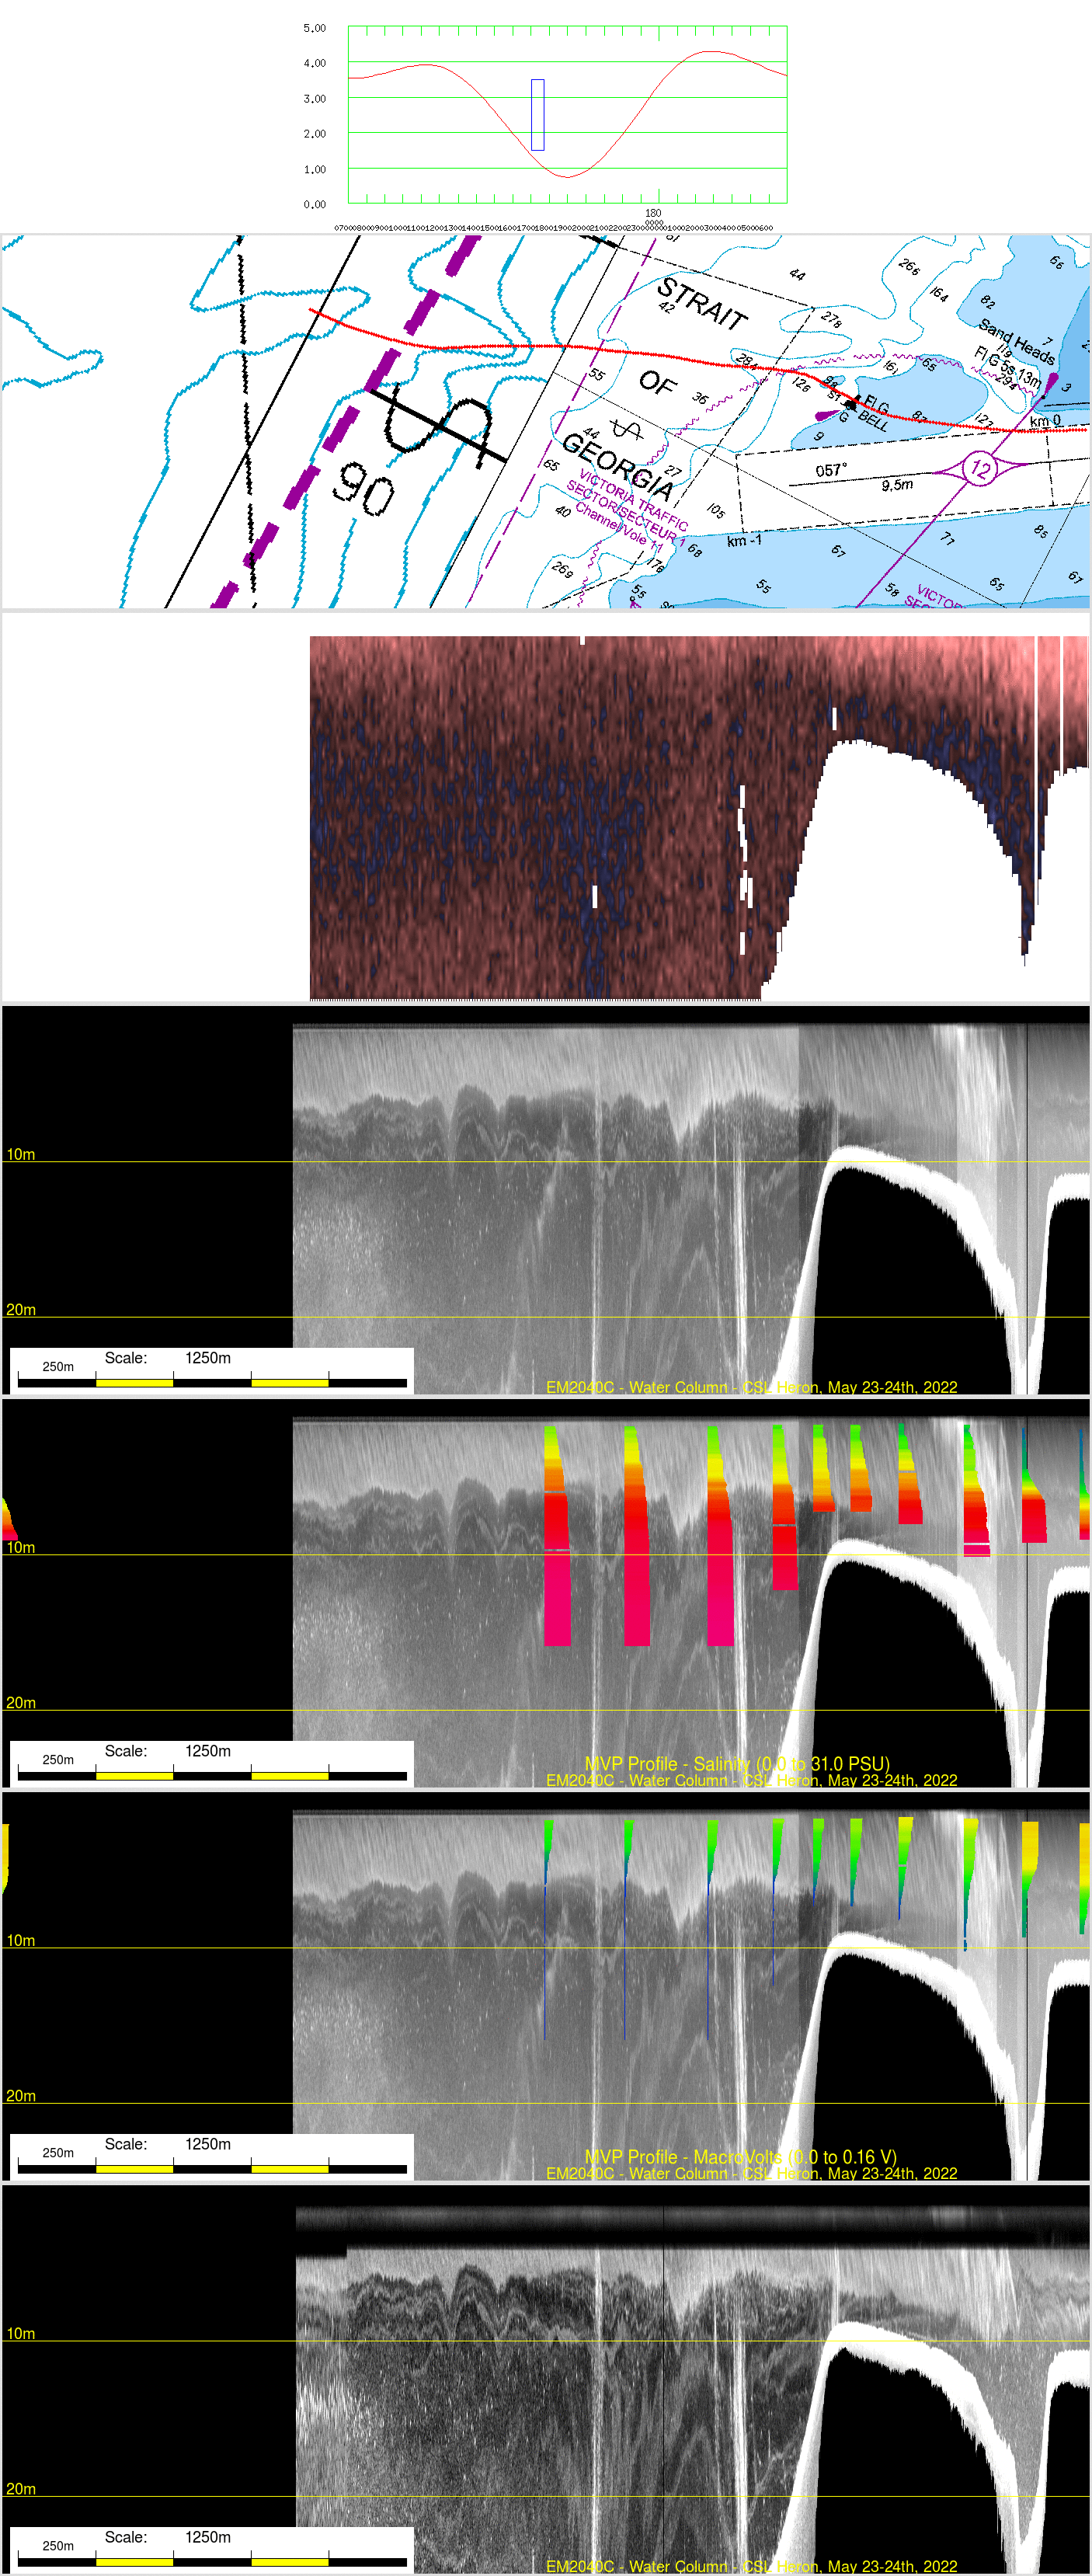 |
JD 179 B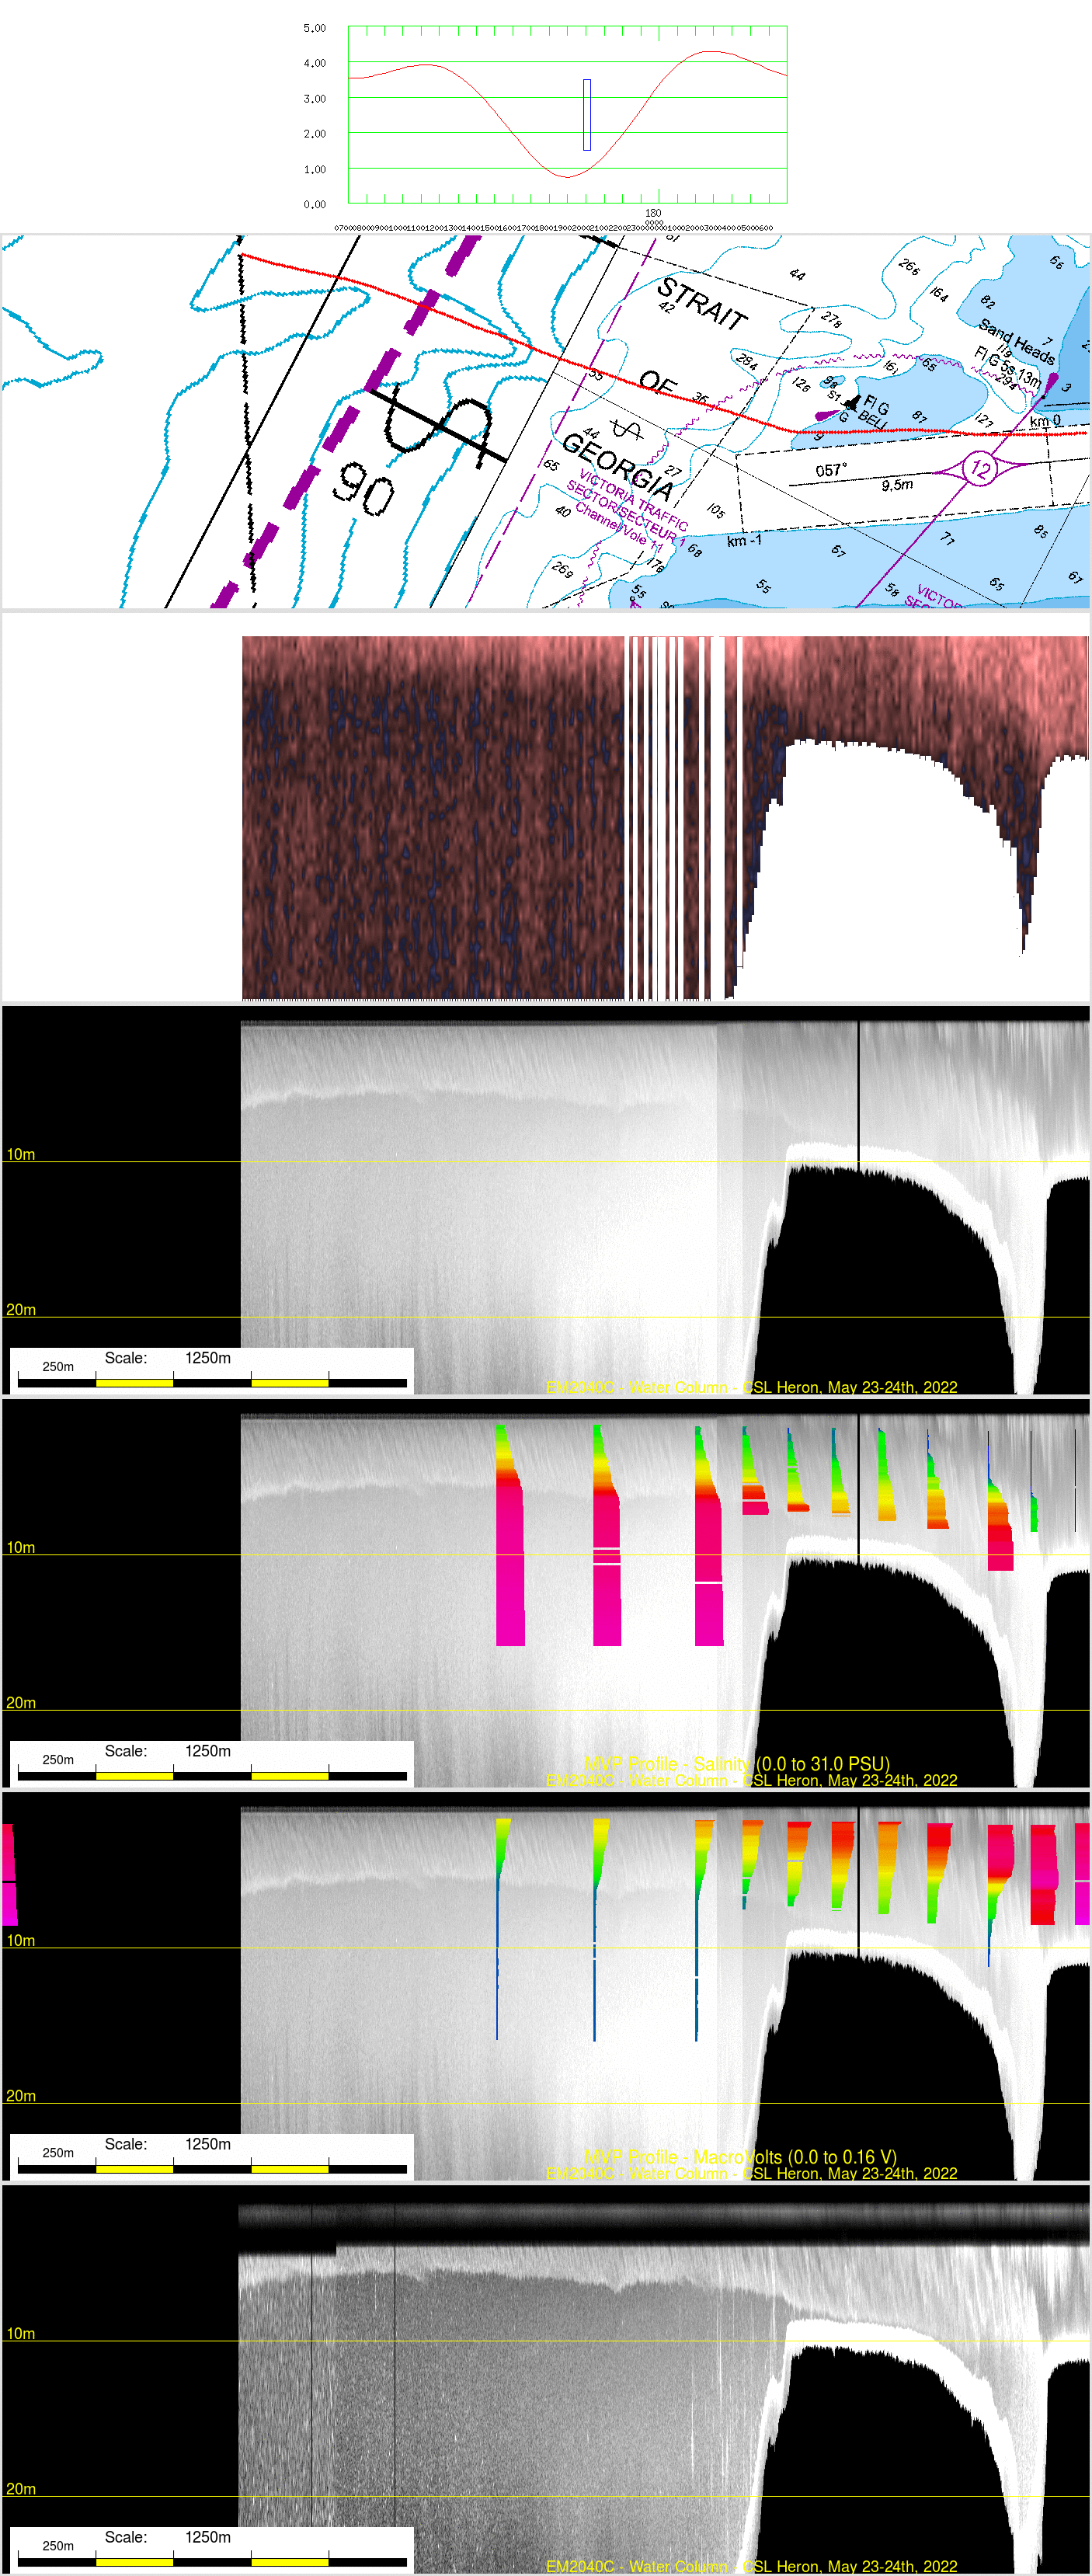 |
JD 179 C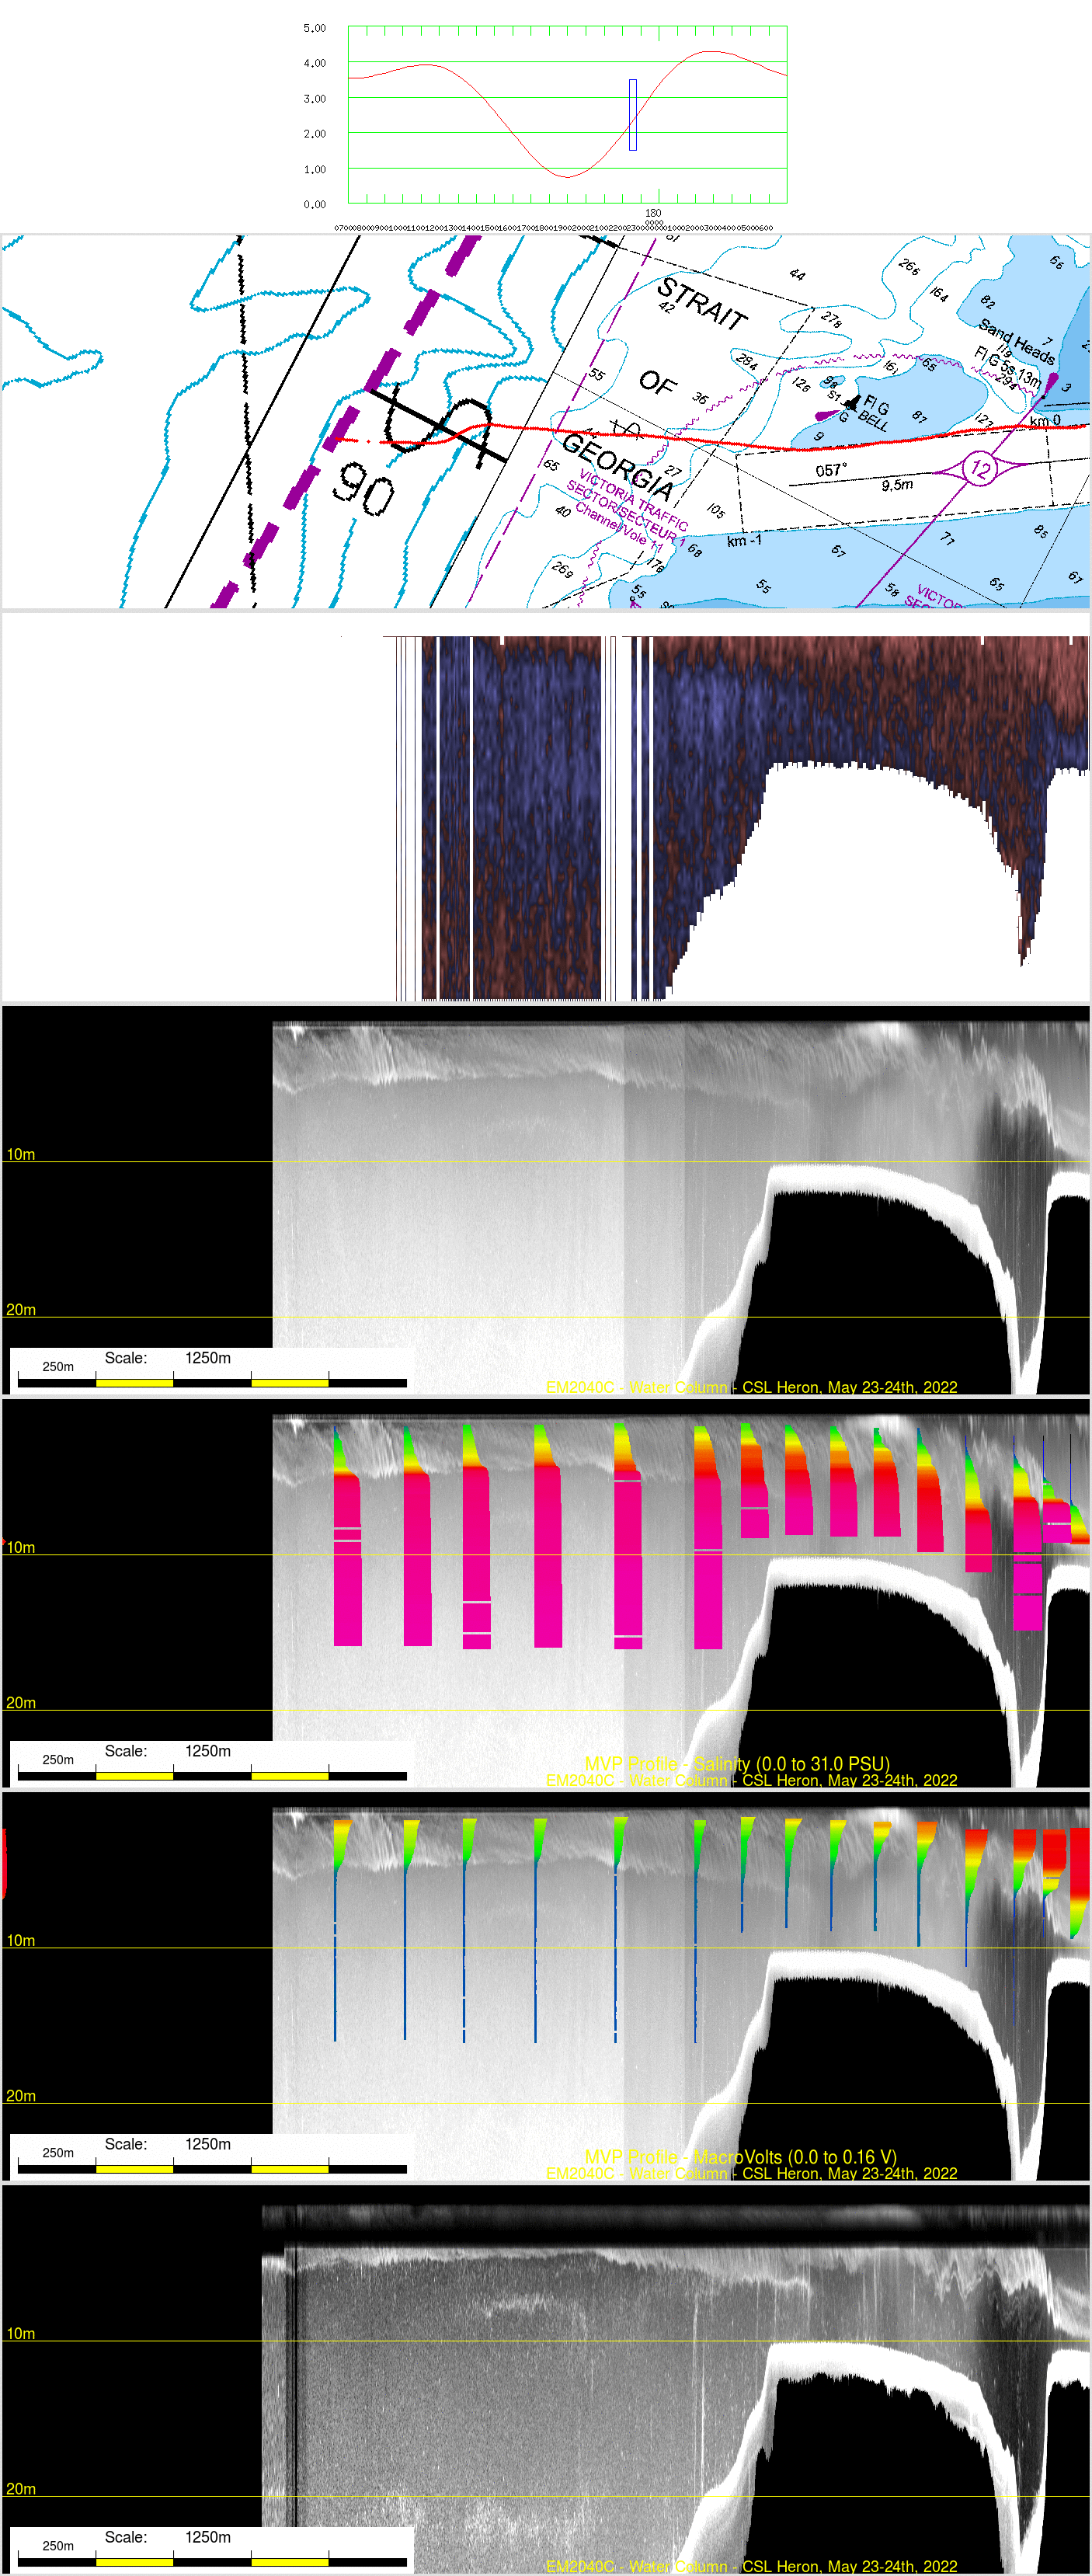 |
JD 179 D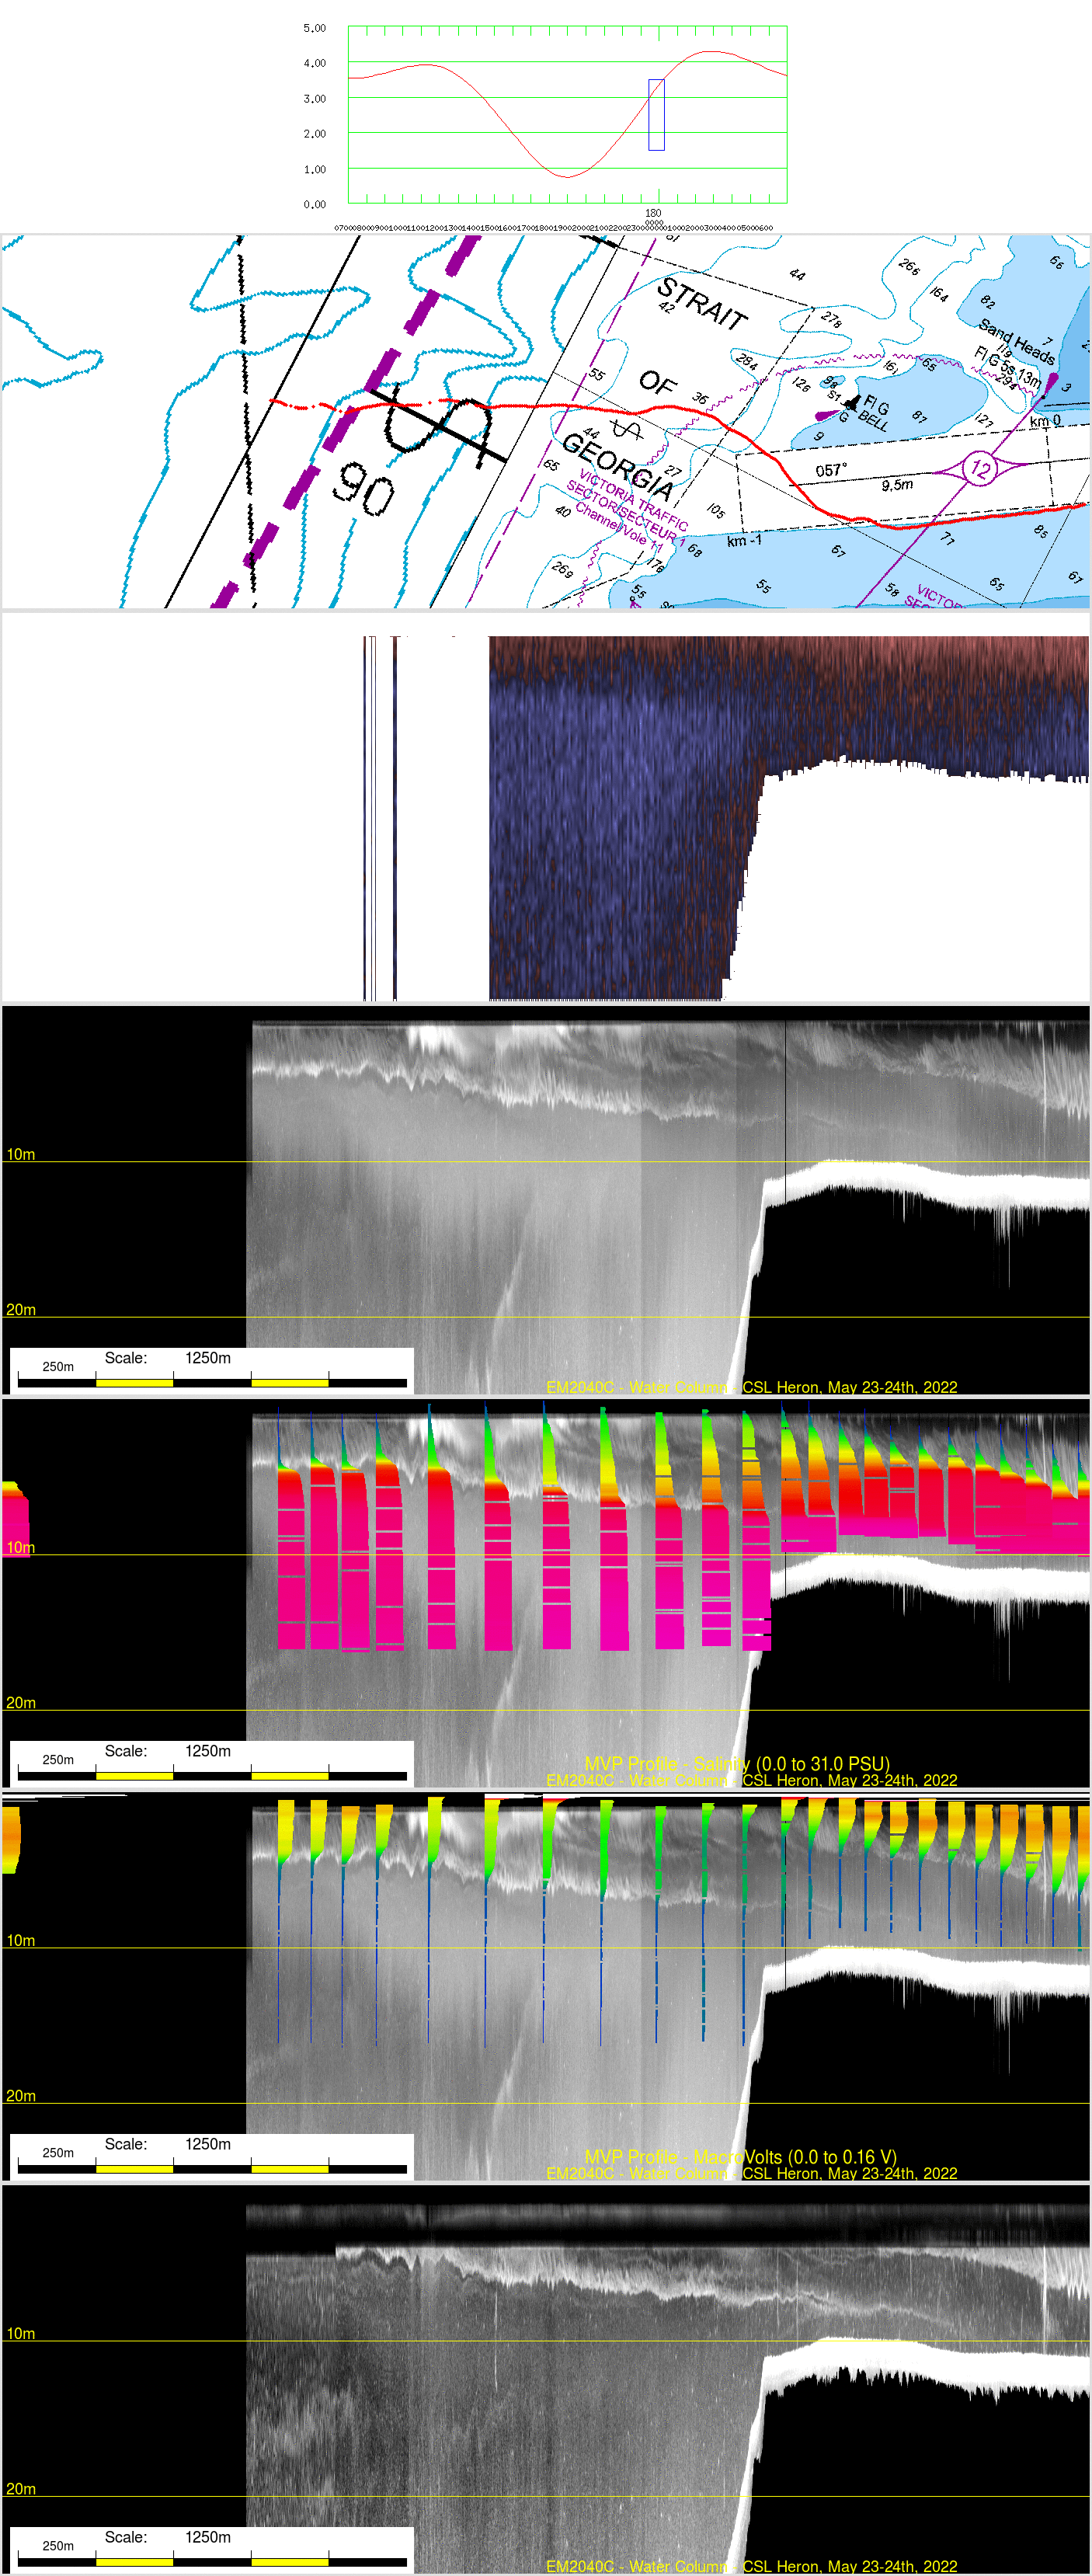 |
JD 180 A |

| Across Mouth - JD 179 Section A 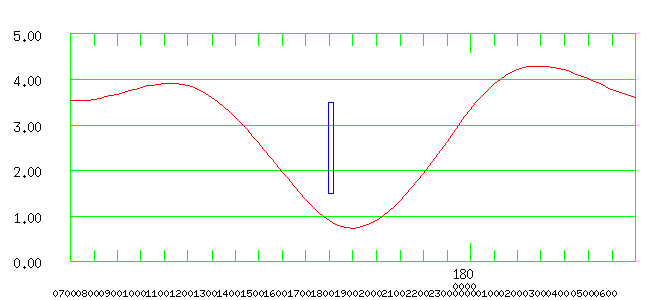 just before LW |
Across Mouth JD
179 Section B 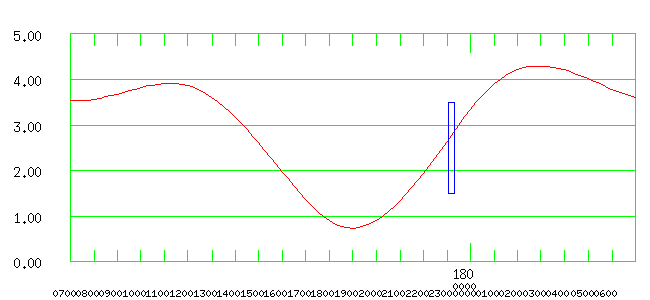 half way up the rising tide |
EM2040 scattering with MVP
observations superimposed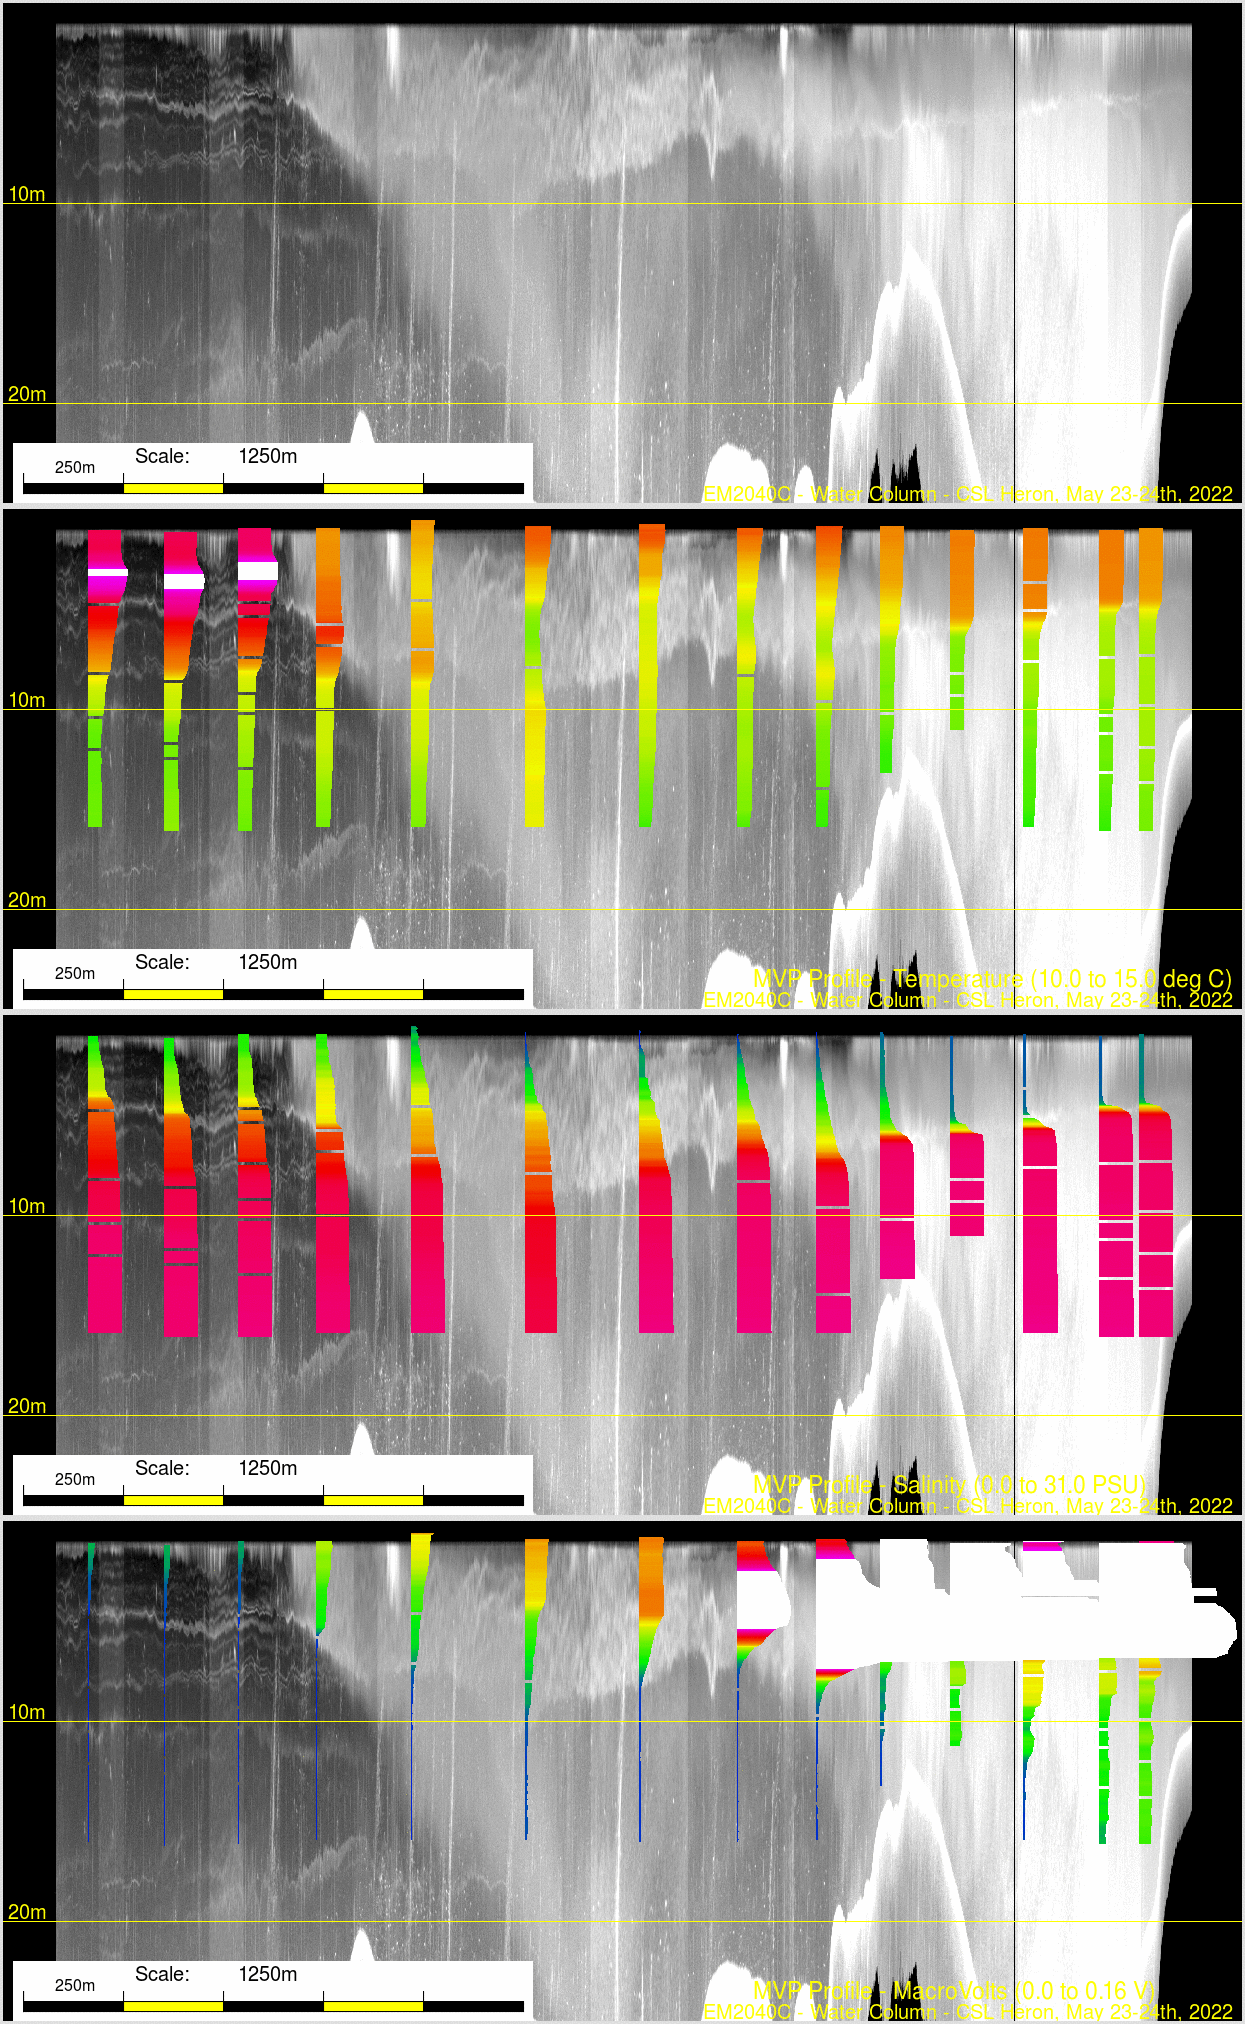 clearly - just on the southern side, the surface plume suspended sediment load is highest. And it is the one region where we see extensive evidence of suspended sediment leaking into the lower layer. maybe it is just being swept off the adjacent tidal flats? |
EM2040 scattering with MVP
observations superimposed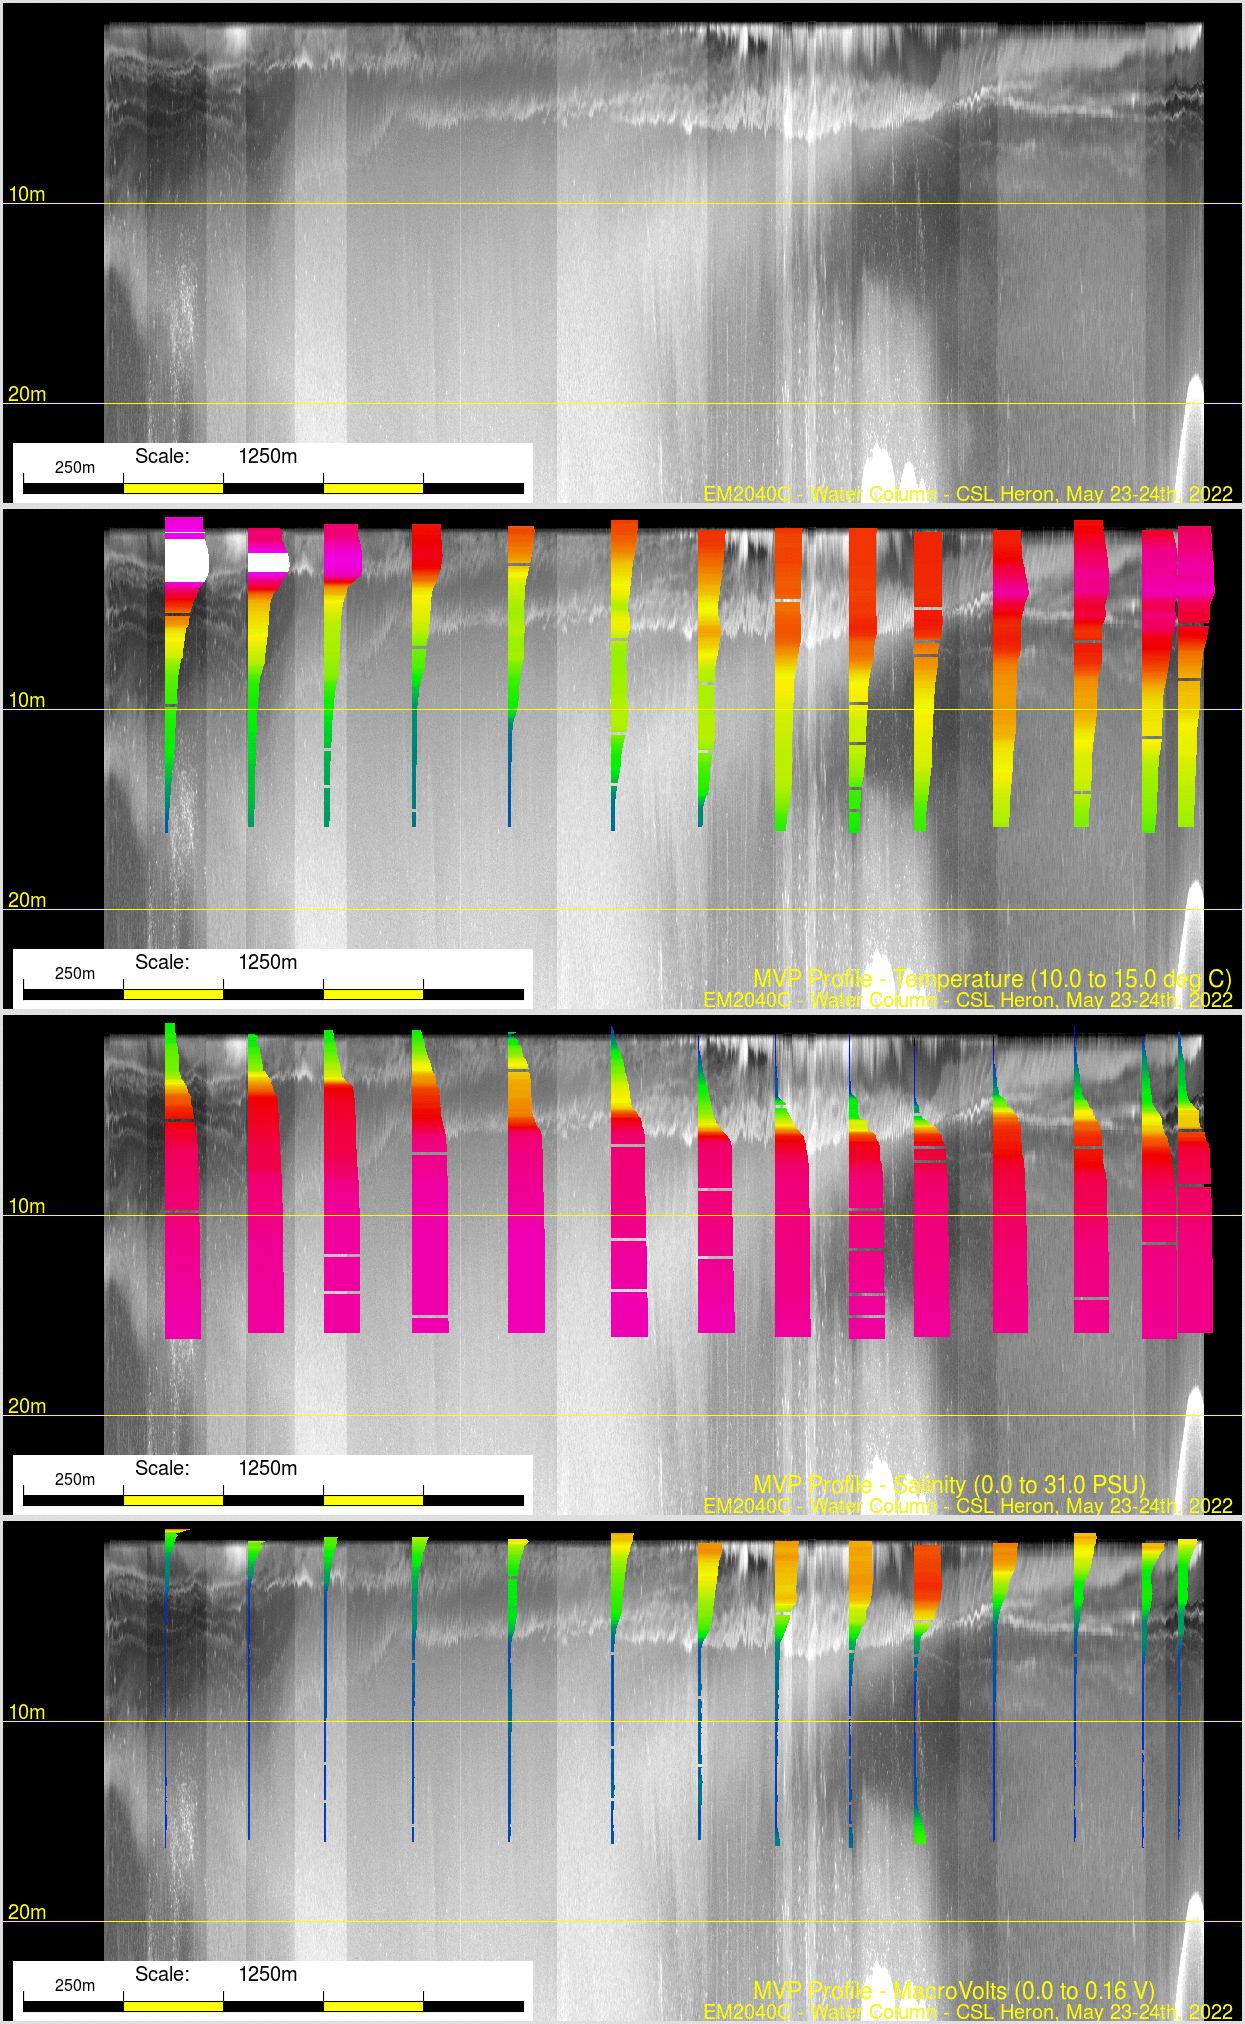 in both examples, you see the warm subsurface layer creeping in from the north around the Sand Head light. |
EM712 scattering with MVP
observations superimposed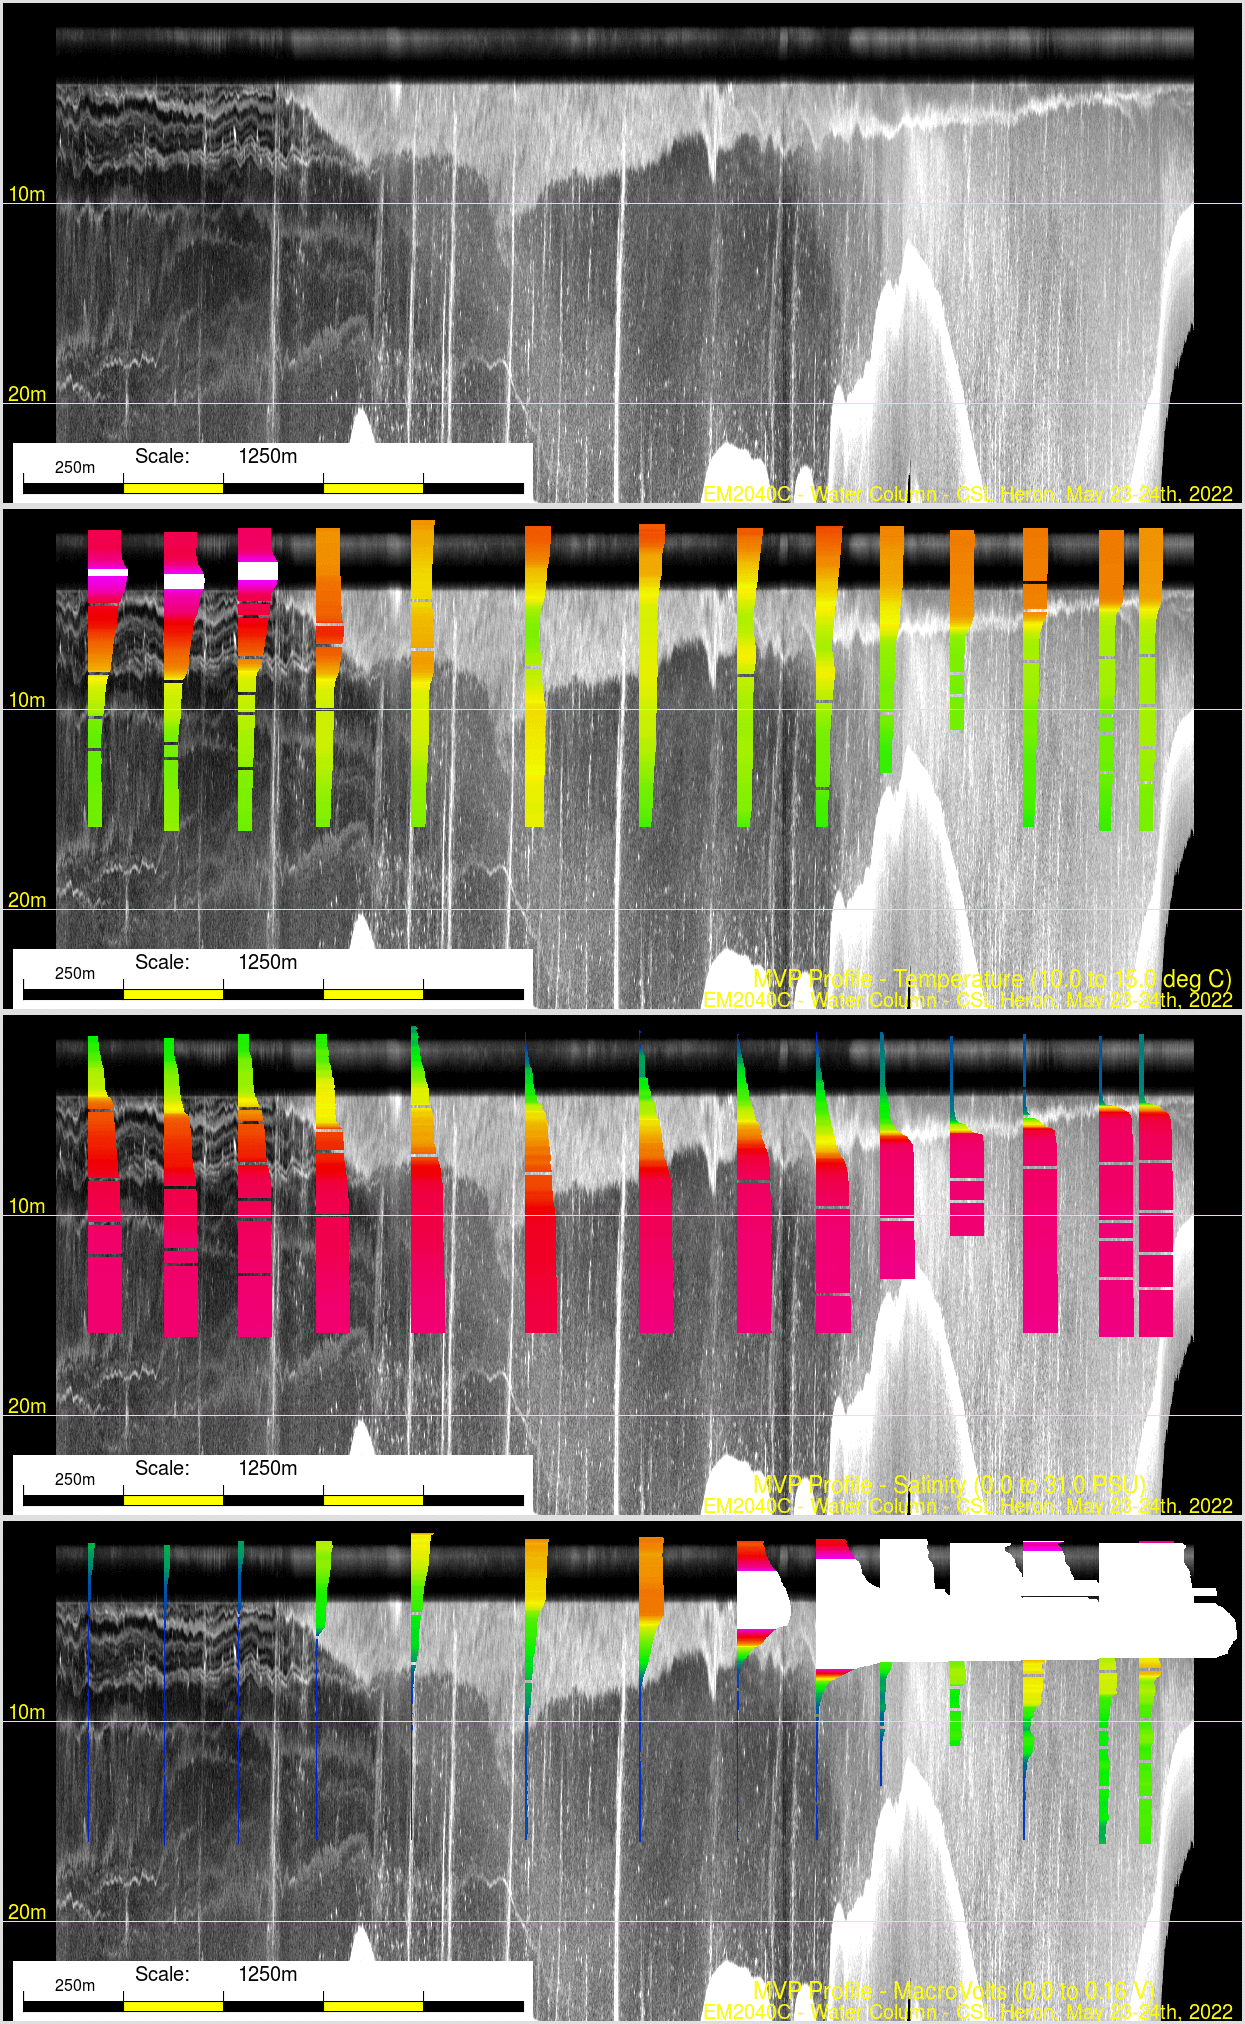 |
EM712 scattering with MVP
observations superimposed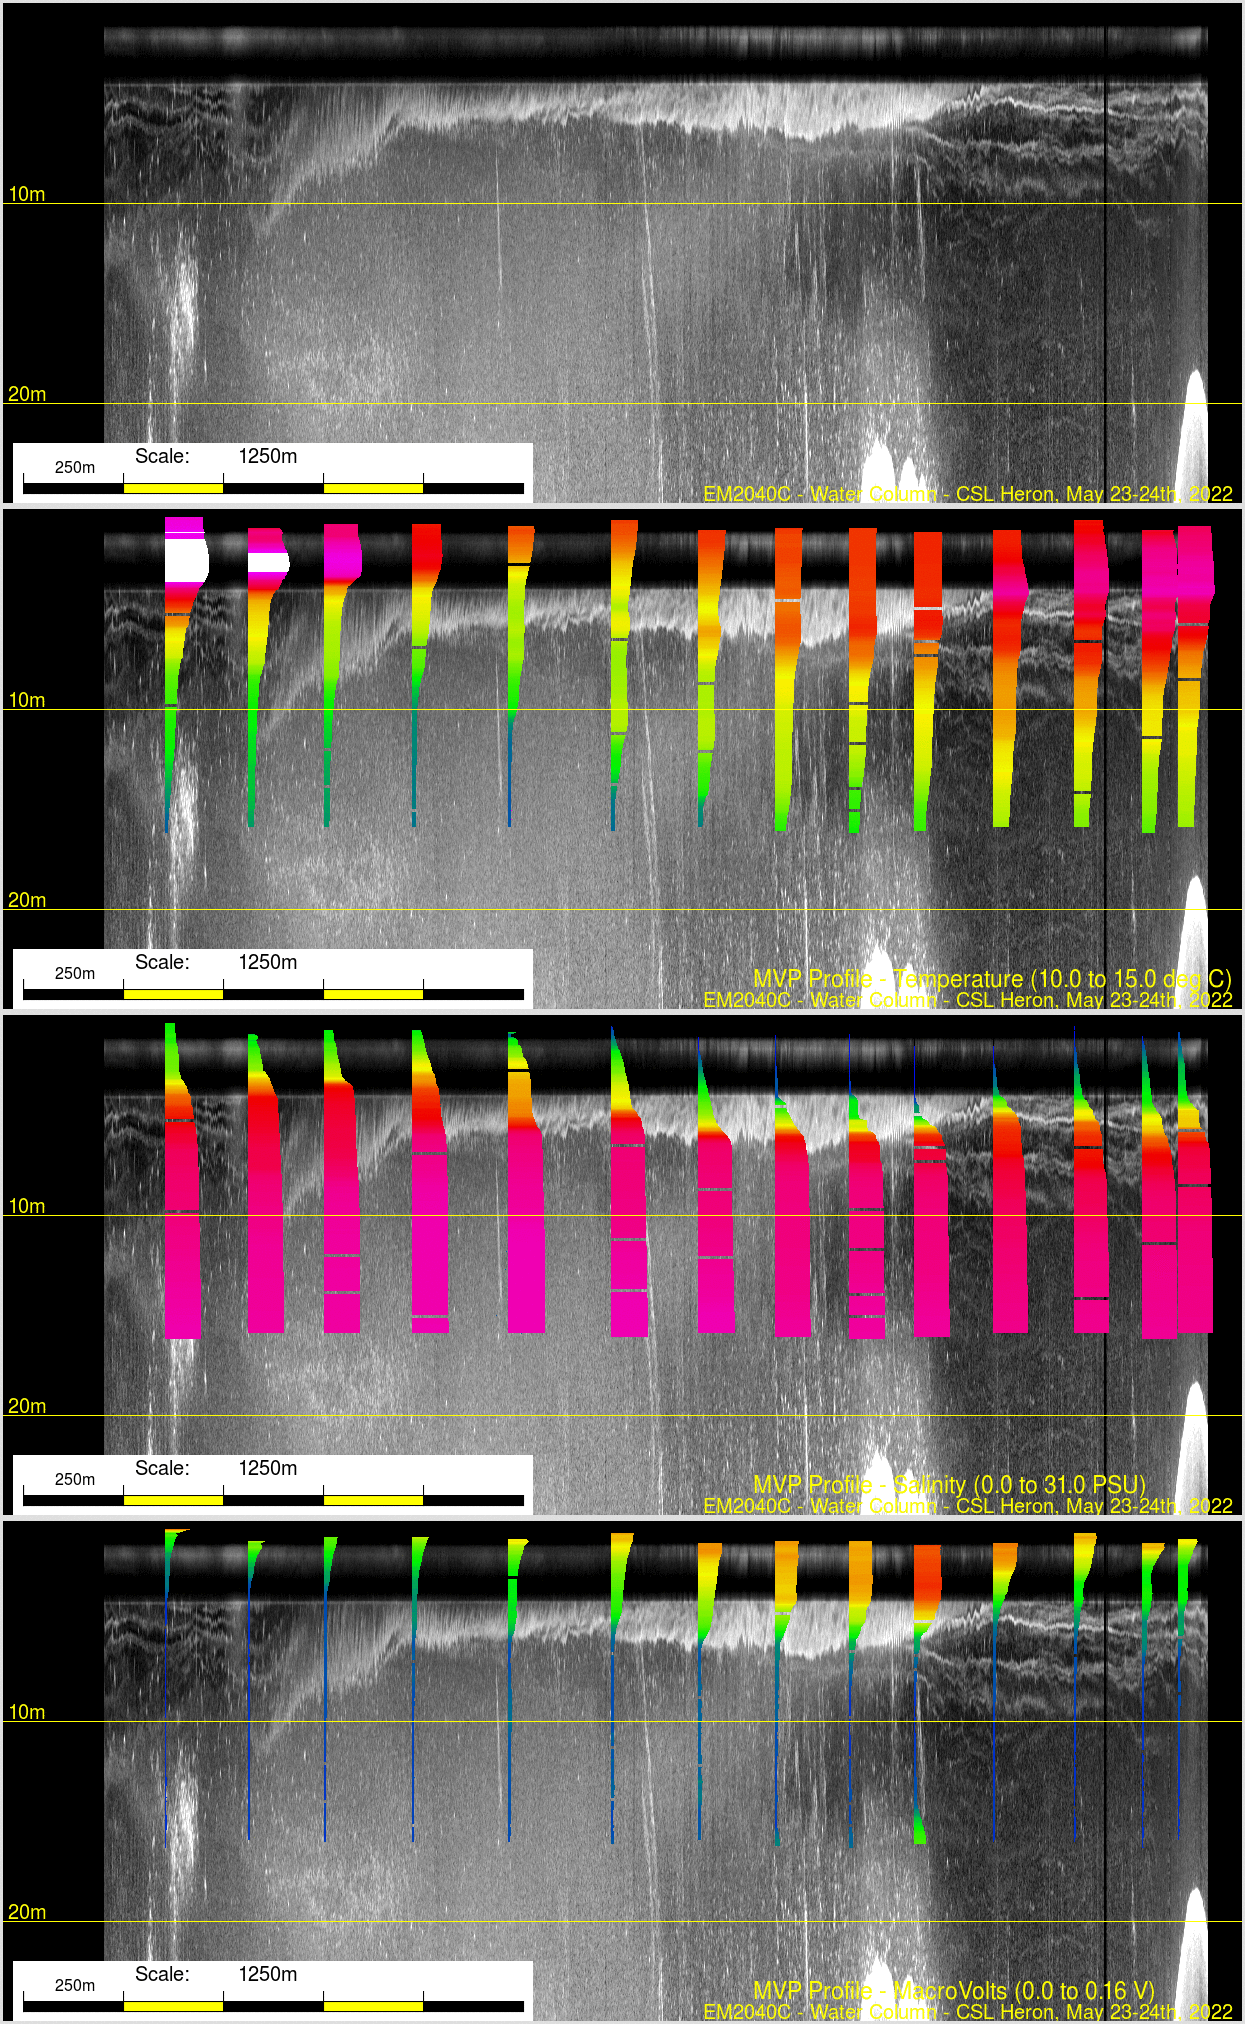 |
|
ADCP observations
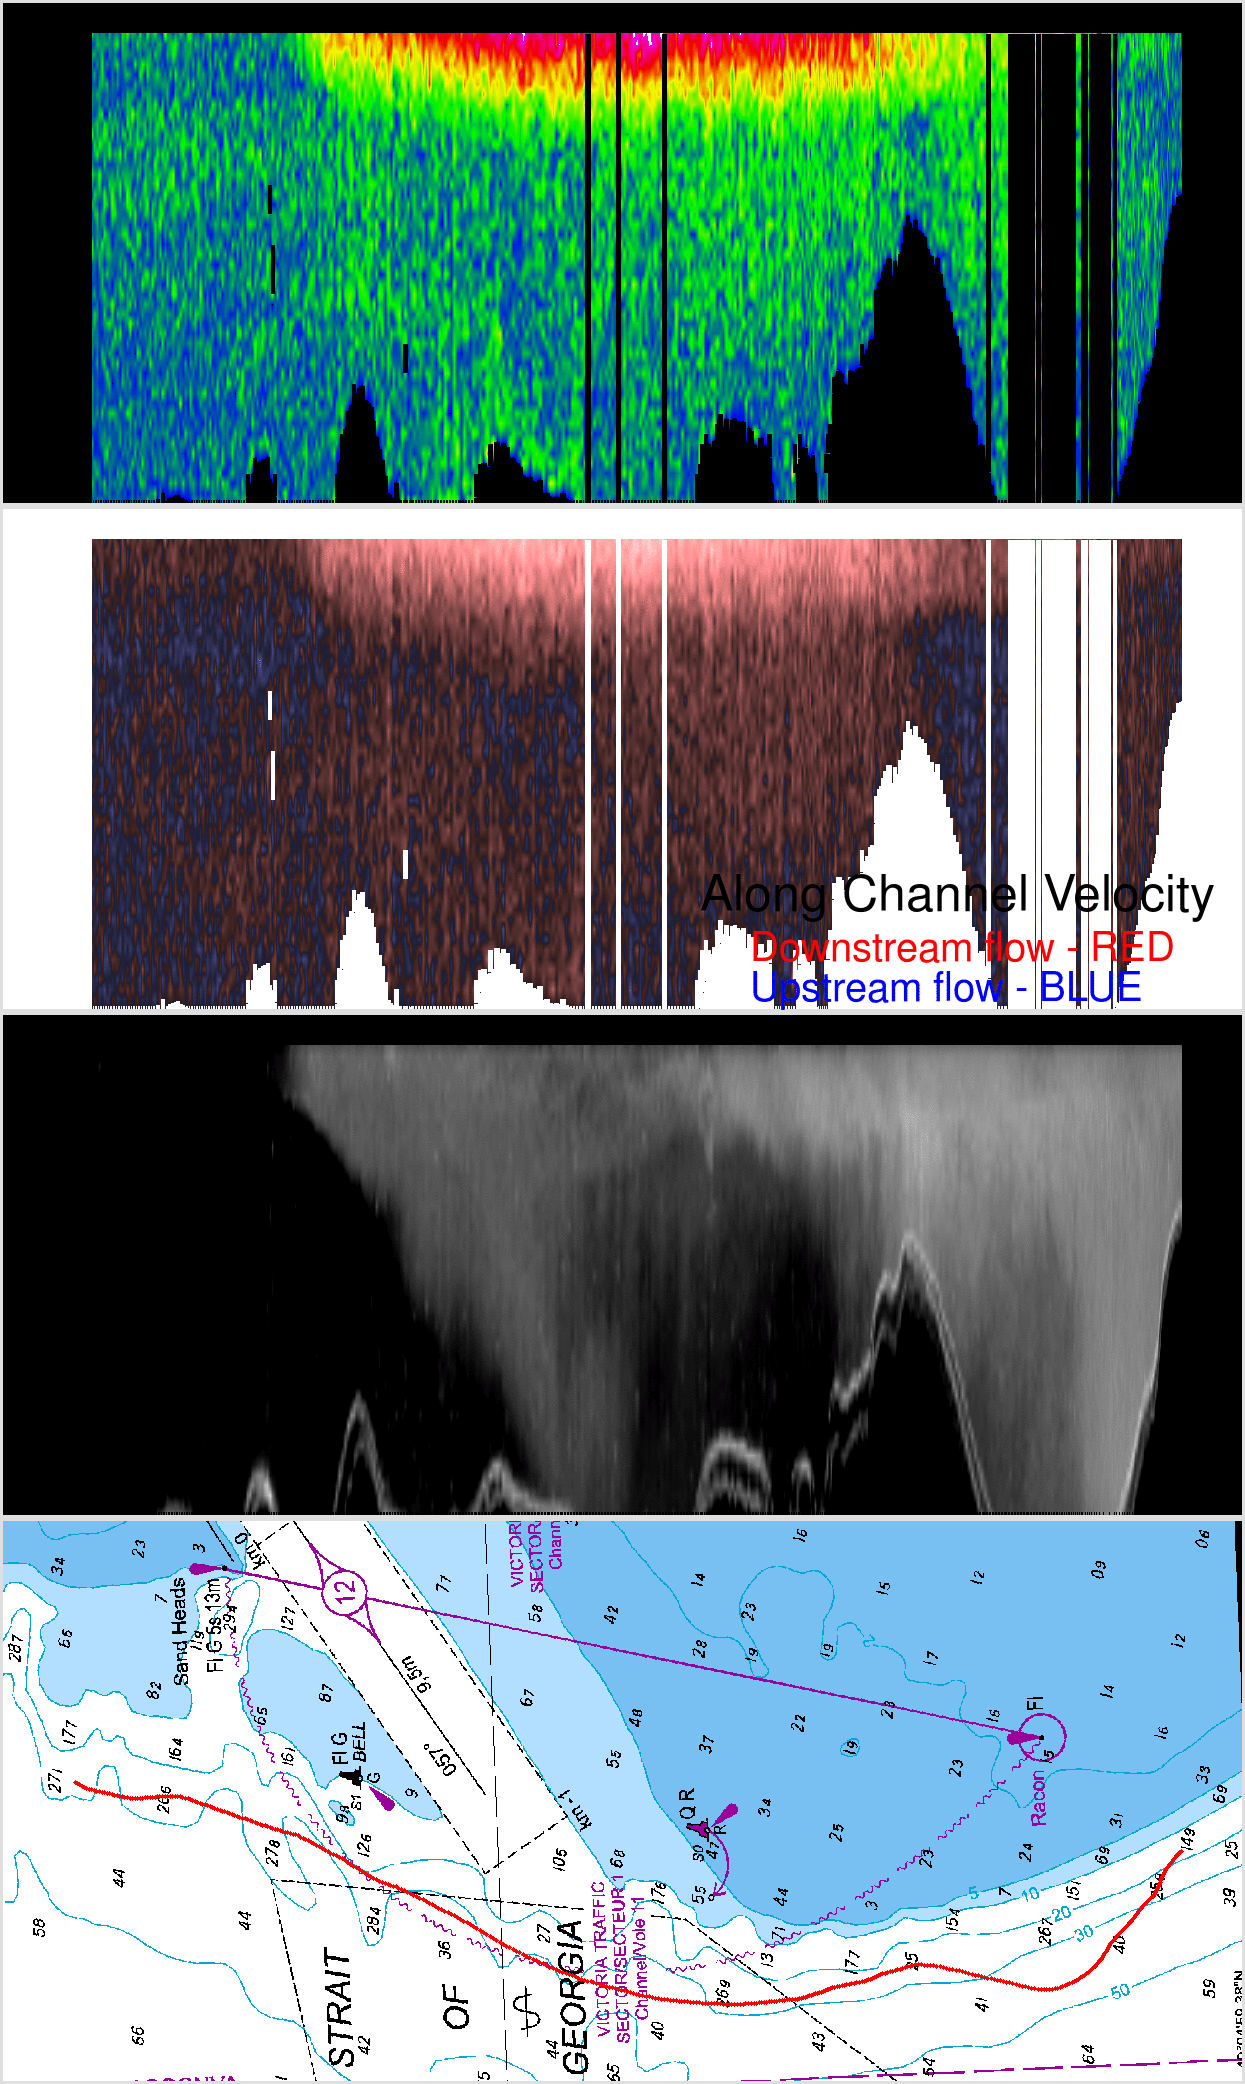 |
ADCP observations |