 |
Lameque Bay Plume Shippagan Bay Survey 2003 John E. Hughes Clarke, Anya Duxfield and Beth-Anne Martin Ocean Mapping Group University of New Brunswick |
|
Lameque Bay Plume Shippagan Bay Survey 2003 John E. Hughes Clarke, Anya Duxfield and Beth-Anne Martin Ocean Mapping Group University of New Brunswick |
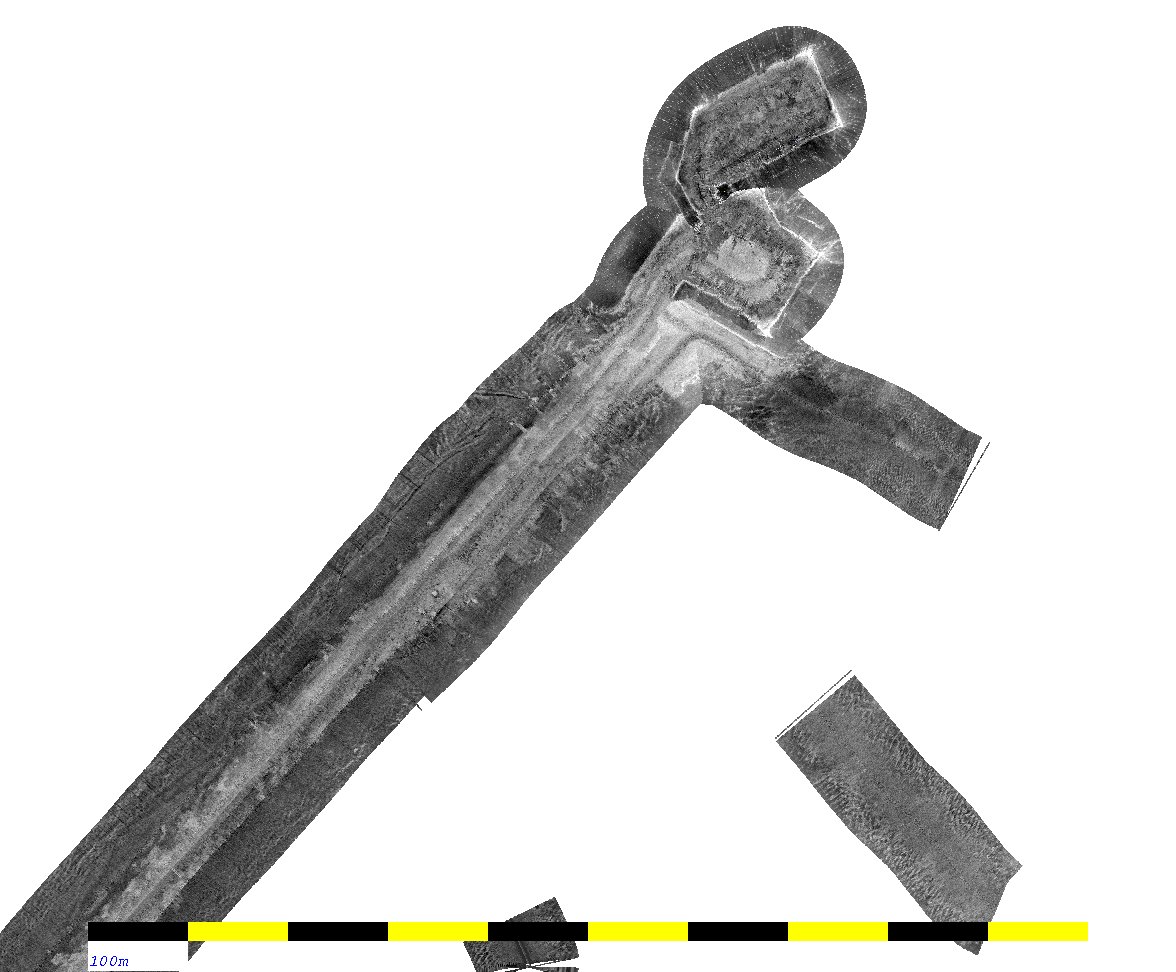
 Using
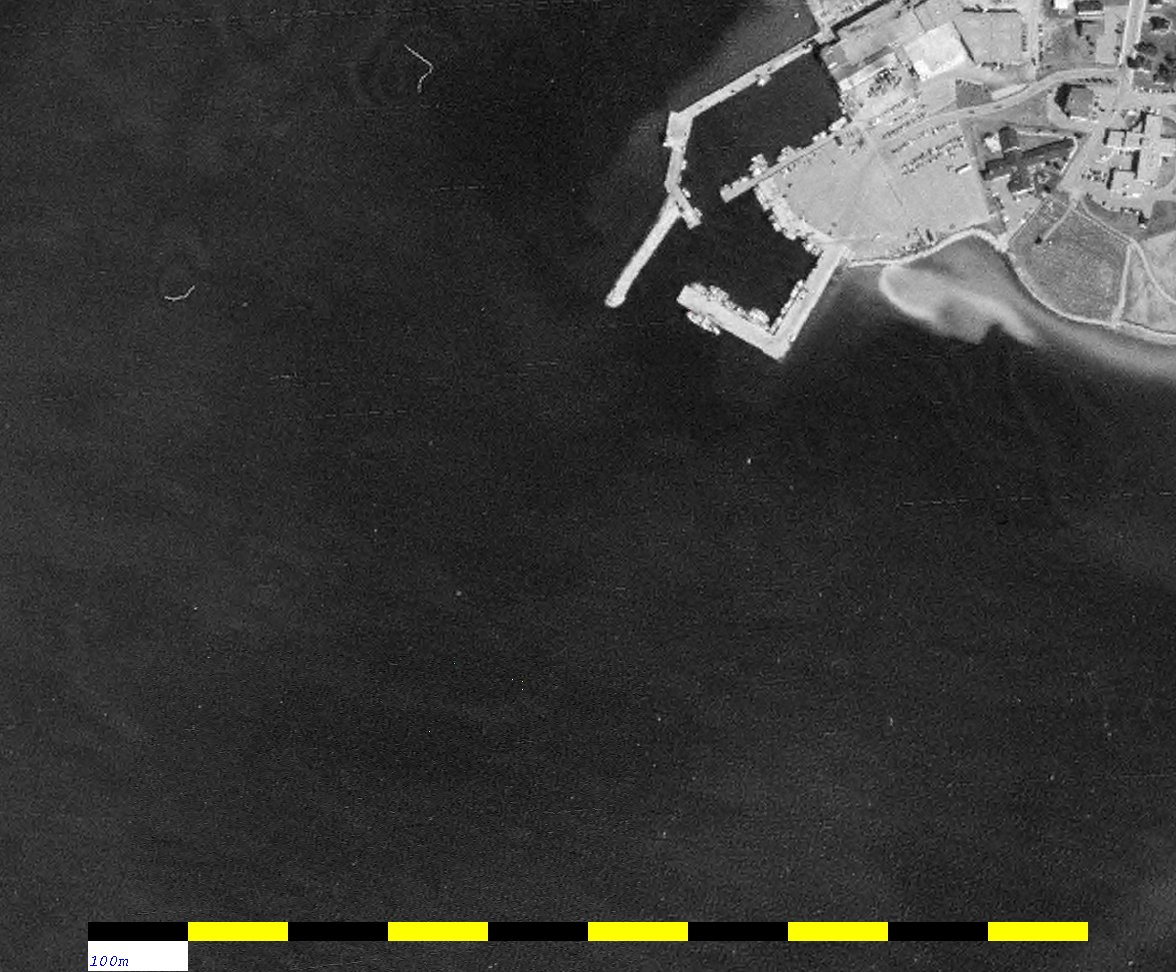
the 200 kHz backscatter signal (image to right) from the
keel-mounted sidescans we get a much better picture of the entire
harbour approaches area. From this we can clearly see that the high
backscatter anomaly (bright area) sweeps around the mouth of the
harbour to the east and suggests a source right on the beach at the
location of the outfall pipe. This strongly suggests a causal
relationship between the source of this anomalous high backscatter
sediment and the plume of material being ejected out the effluent pipe.
Using
the 200 kHz backscatter signal (image to right) from the
keel-mounted sidescans we get a much better picture of the entire
harbour approaches area. From this we can clearly see that the high
backscatter anomaly (bright area) sweeps around the mouth of the
harbour to the east and suggests a source right on the beach at the
location of the outfall pipe. This strongly suggests a causal
relationship between the source of this anomalous high backscatter
sediment and the plume of material being ejected out the effluent pipe.
 The
last image shown here (left) is more 200 kHz sidescan that was
collected when the dredged channel and the inner harbour surveys were
conducted. This confirms that the high backscatter sediment is not
extending into the harbour itself (and thus is not originating from in
there). As the inner harbour is extensively dredged, it suggests that
the dredging itself is not the cause of the high backscatter.
The
last image shown here (left) is more 200 kHz sidescan that was
collected when the dredged channel and the inner harbour surveys were
conducted. This confirms that the high backscatter sediment is not
extending into the harbour itself (and thus is not originating from in
there). As the inner harbour is extensively dredged, it suggests that
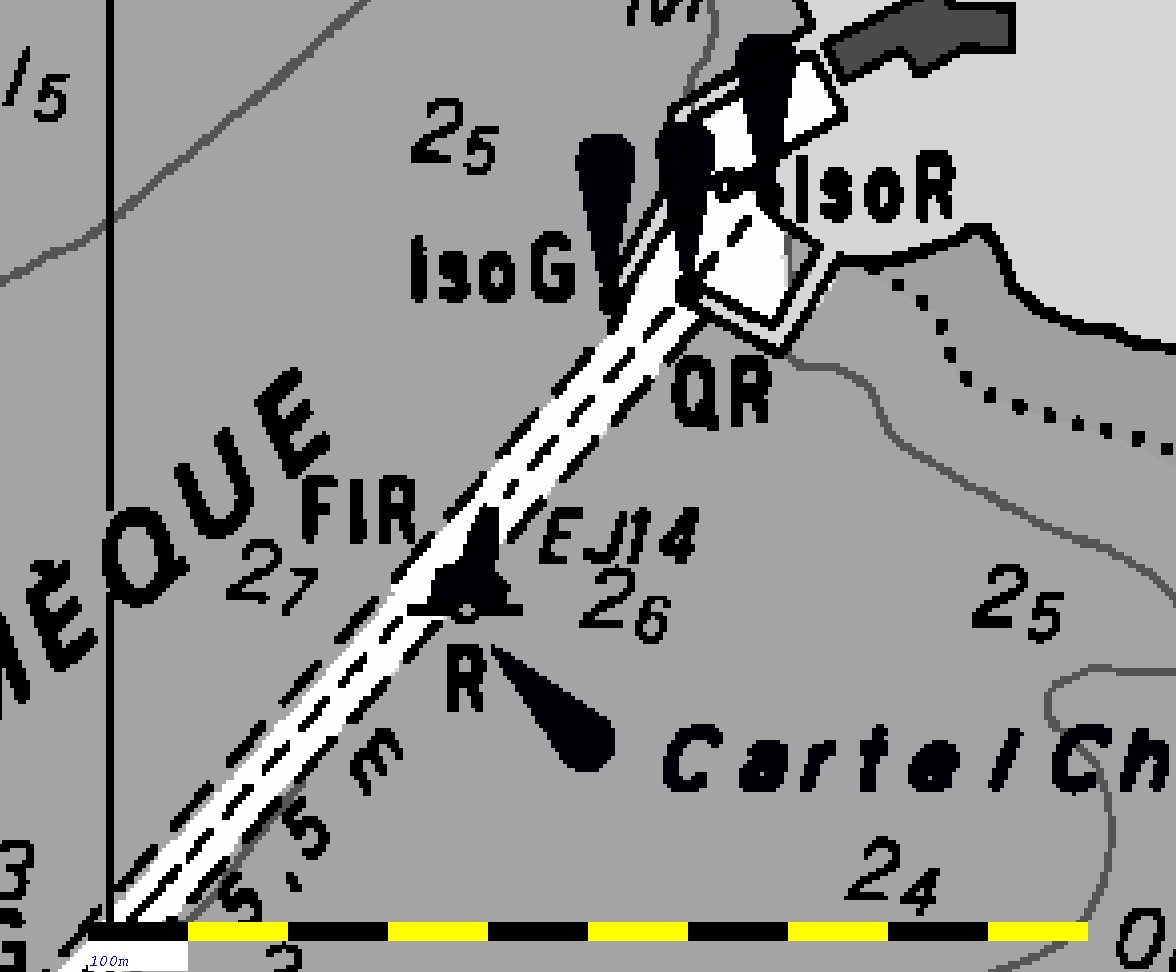
the dredging itself is not the cause of the high backscatter. 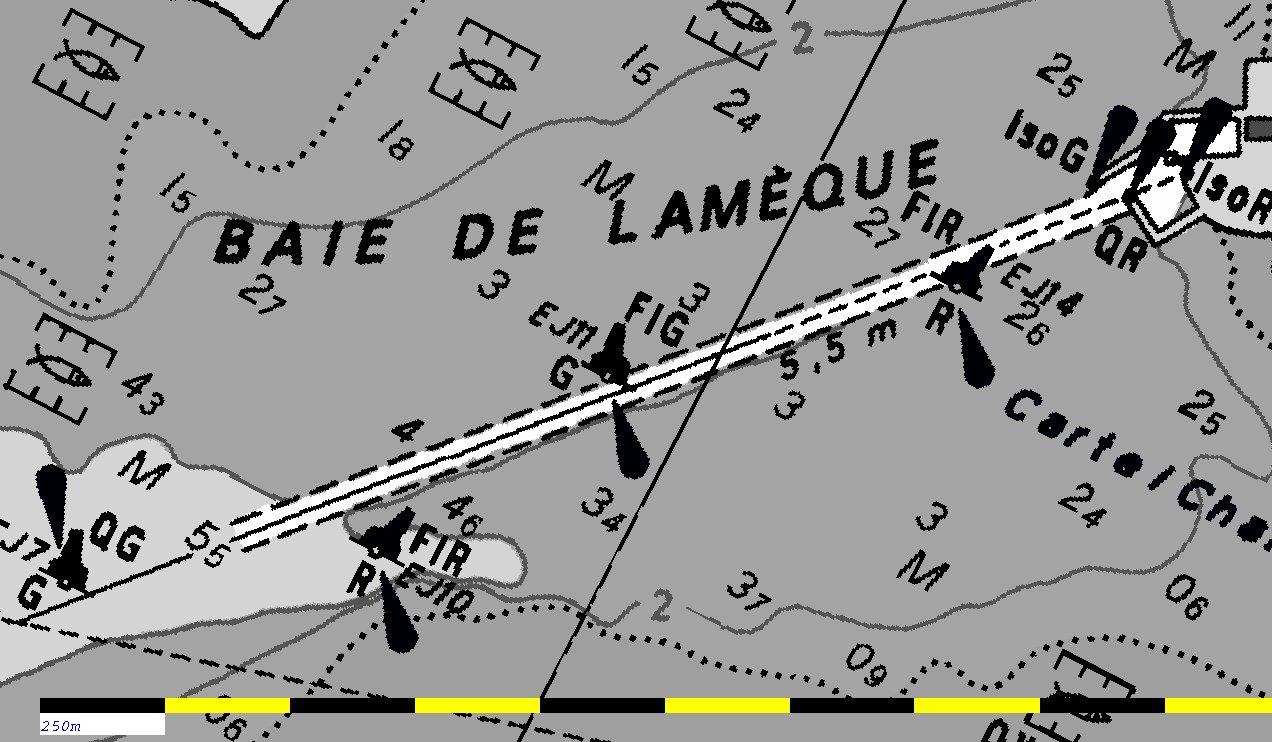 Whilst
it is easy to see the plume signature immediately to the east of
the harbour mouth, it is less clear, where the distal limits of the
plume are. The following series of images help delineate how far out
into the bay this backscatter signature extends. These images examine
the full length of the dredged channel, extending from harbour entrance
by the break water to the limit of dredging. The extract from chart
4913 (left) defines the regional distribution of depths.
Whilst
it is easy to see the plume signature immediately to the east of
the harbour mouth, it is less clear, where the distal limits of the
plume are. The following series of images help delineate how far out
into the bay this backscatter signature extends. These images examine
the full length of the dredged channel, extending from harbour entrance
by the break water to the limit of dredging. The extract from chart
4913 (left) defines the regional distribution of depths.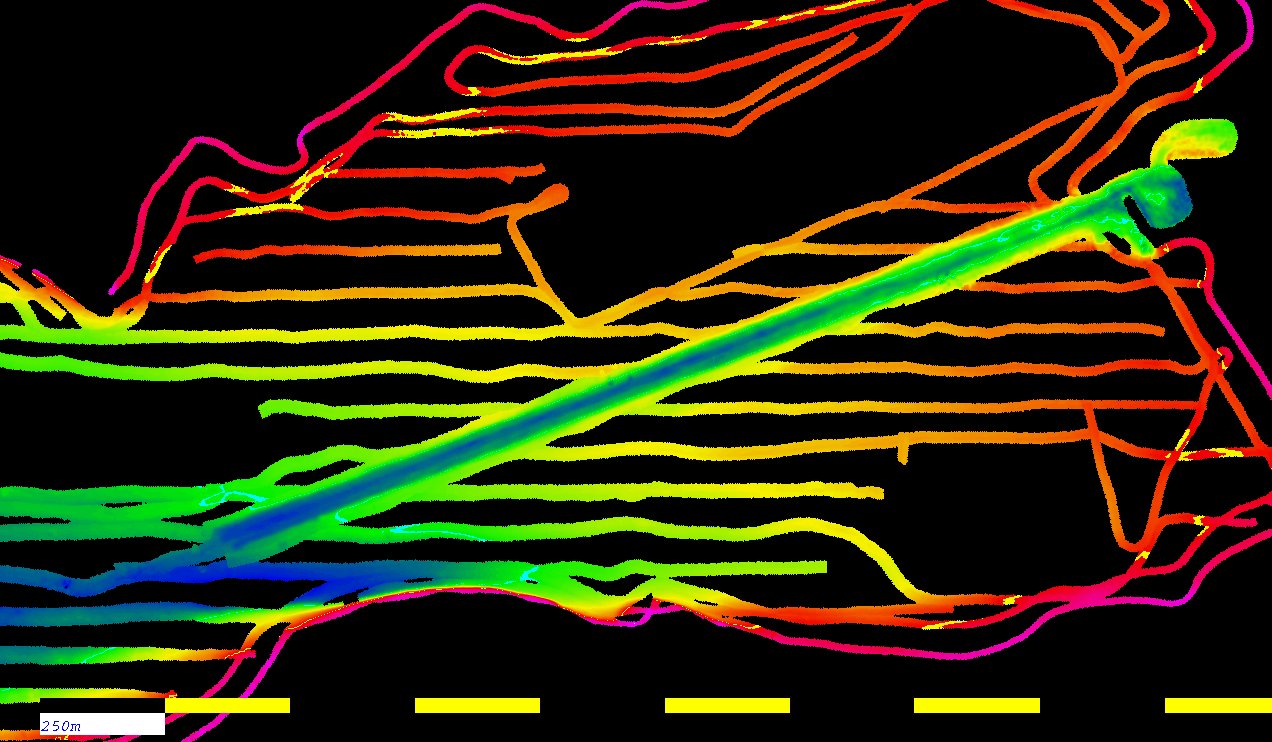 This
next image shows the extent of multibeam bathymetric coverage in the
bay (figure to right, colour range 0-7m below chart datum). The main
survey lines are 80m apart but a special survey was conducted of the
dredged channel and the inside of the harbour itself. On its own,
little indication can be seen of the anomalous region. However, from
the same dataset we can examine the distribution of 300 kHz backscatter
strength in the area (next image). We can then compare the backscatter
signature with the depth distribution.
This
next image shows the extent of multibeam bathymetric coverage in the
bay (figure to right, colour range 0-7m below chart datum). The main
survey lines are 80m apart but a special survey was conducted of the
dredged channel and the inside of the harbour itself. On its own,
little indication can be seen of the anomalous region. However, from
the same dataset we can examine the distribution of 300 kHz backscatter
strength in the area (next image). We can then compare the backscatter
signature with the depth distribution. 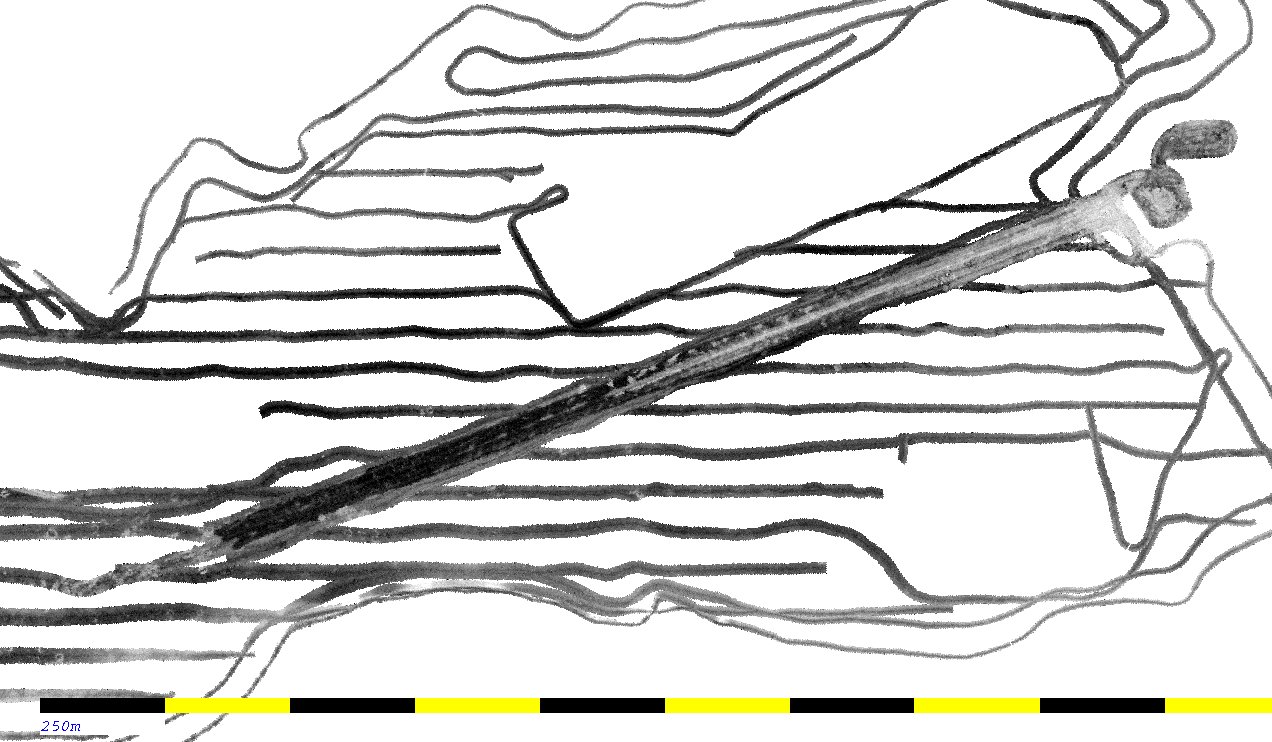 The
300 kHz backscatter clearly shows that the northeastern half of the
channel floor is high backscatter (bright), changing gradually to a
lower backscatter than the surrounding sediments of the bay as one
moves to the southwest. Interestingly the high backscatter data
is restricted to the central axis of the channel but includes a series
of circular high backcsatter anomalies on either side of the centre of
the channel. If we look at the bathymetric model in more detail we see
that the channel is deepest along its central axis , but that there are
a series of small depressions on either side of the channel axis which
matches the location of the small circular high backscatter
anomalies.
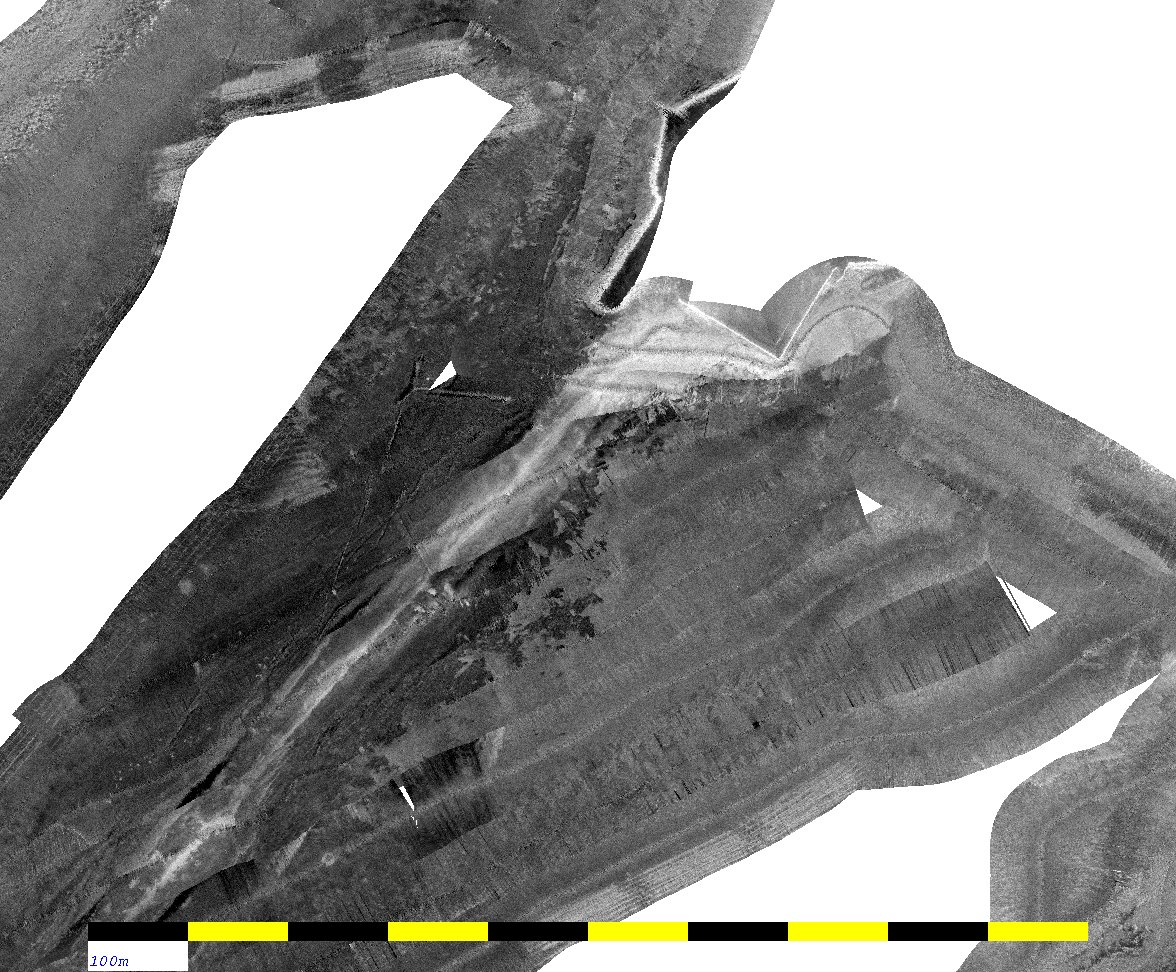
The
300 kHz backscatter clearly shows that the northeastern half of the
channel floor is high backscatter (bright), changing gradually to a
lower backscatter than the surrounding sediments of the bay as one
moves to the southwest. Interestingly the high backscatter data
is restricted to the central axis of the channel but includes a series
of circular high backcsatter anomalies on either side of the centre of
the channel. If we look at the bathymetric model in more detail we see
that the channel is deepest along its central axis , but that there are
a series of small depressions on either side of the channel axis which
matches the location of the small circular high backscatter
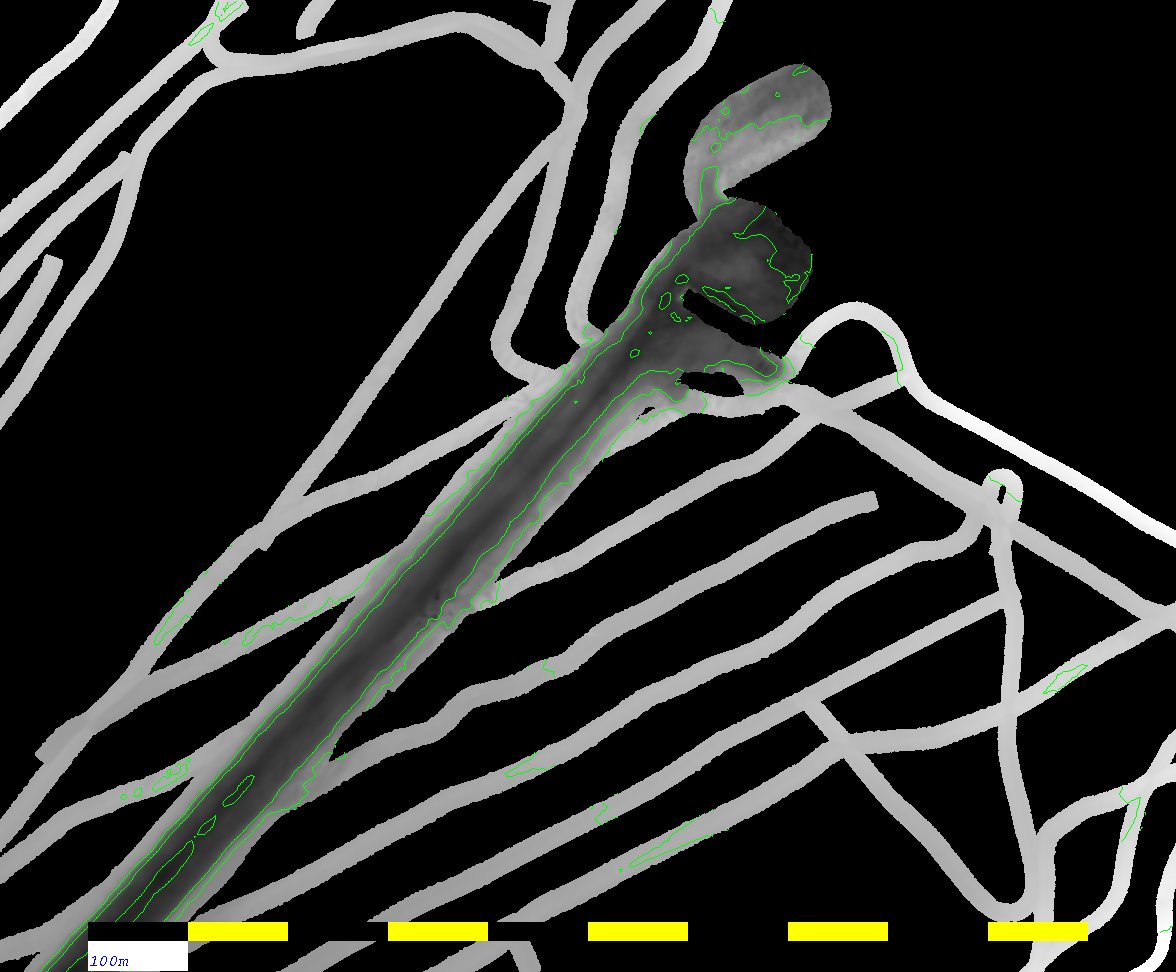
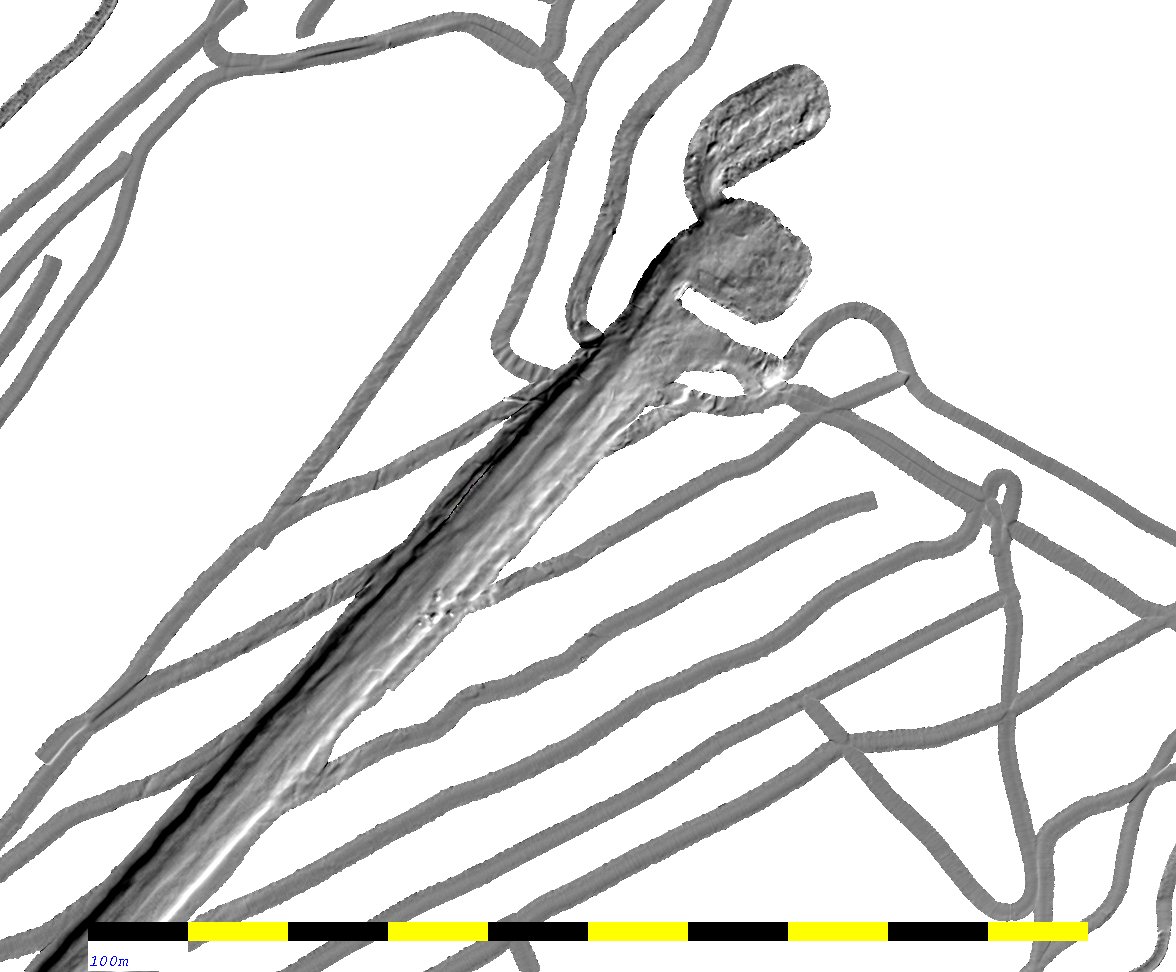
anomalies. 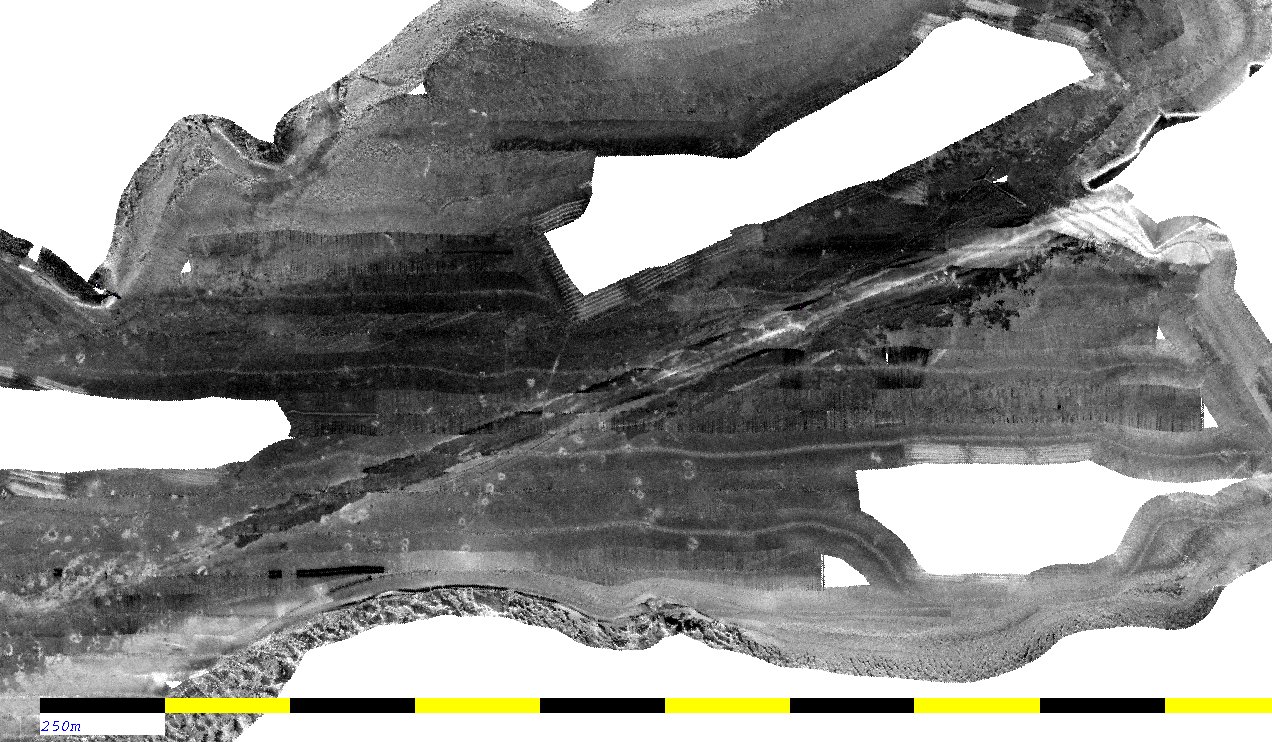 The
multibeam-derived 300kHz backscatter is better at delineating the
sediment distribution on the floor of the dredged channel as it casts
less shadows than the lower-aspect-ratio sidescans. Nevertheless the
sidescan provides the only complete picture of the sediment
distribution on the bay. As we can see (image to left) one can
recognise tthe individual deposits of the dredge spoil at the SW end of
the dredged channel . The ultimate limit of the dredging is seen as an
abrupt change in the bottom backscatter. The SW end of the dredged
channel is clearly filled with a very uniform sheet of low backscatteer
sediment (see discussion below comparing this with the Shippagan
Approaches dredged channel).
The
multibeam-derived 300kHz backscatter is better at delineating the
sediment distribution on the floor of the dredged channel as it casts
less shadows than the lower-aspect-ratio sidescans. Nevertheless the
sidescan provides the only complete picture of the sediment
distribution on the bay. As we can see (image to left) one can
recognise tthe individual deposits of the dredge spoil at the SW end of
the dredged channel . The ultimate limit of the dredging is seen as an
abrupt change in the bottom backscatter. The SW end of the dredged
channel is clearly filled with a very uniform sheet of low backscatteer
sediment (see discussion below comparing this with the Shippagan
Approaches dredged channel).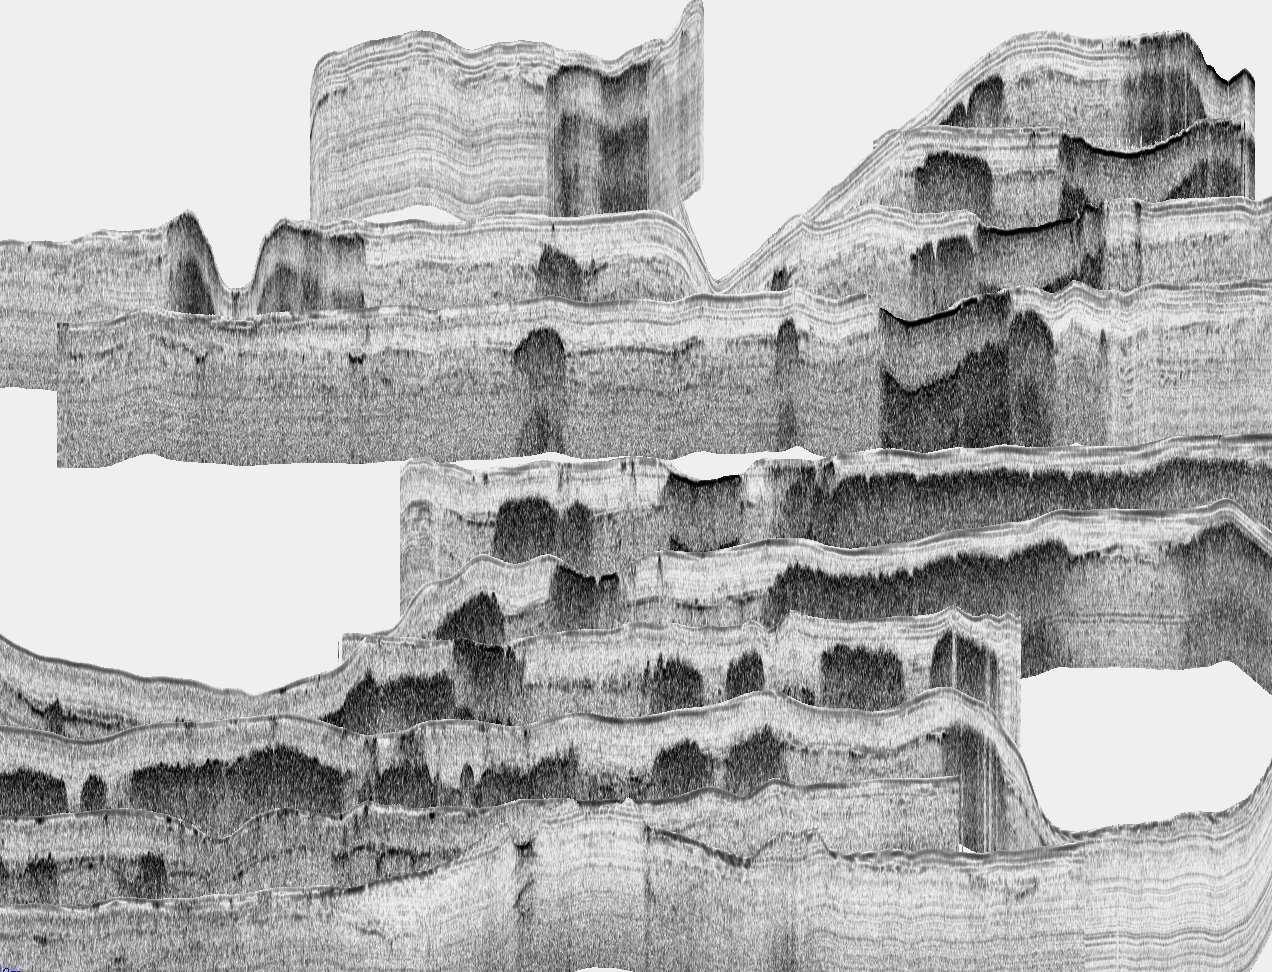 For exactly the same areas we can now look at the 3.5 kHz subbottom
profiles (figure to right) across the Lameque Bay dredged channel.
Remember the lines are spaced at 80m and run obliquely across the
channel. A high surface reflection coefficient anomaly (extra dark
surface echo) just on the dredged channel floor needs explaining.
It looks similar to the buried gas reflectors seen elsewhere in the
bay, except it is at the surface and only occurs on the dredged channel
floor. There are a number of possible causes, including:
For exactly the same areas we can now look at the 3.5 kHz subbottom
profiles (figure to right) across the Lameque Bay dredged channel.
Remember the lines are spaced at 80m and run obliquely across the
channel. A high surface reflection coefficient anomaly (extra dark
surface echo) just on the dredged channel floor needs explaining.
It looks similar to the buried gas reflectors seen elsewhere in the
bay, except it is at the surface and only occurs on the dredged channel
floor. There are a number of possible causes, including: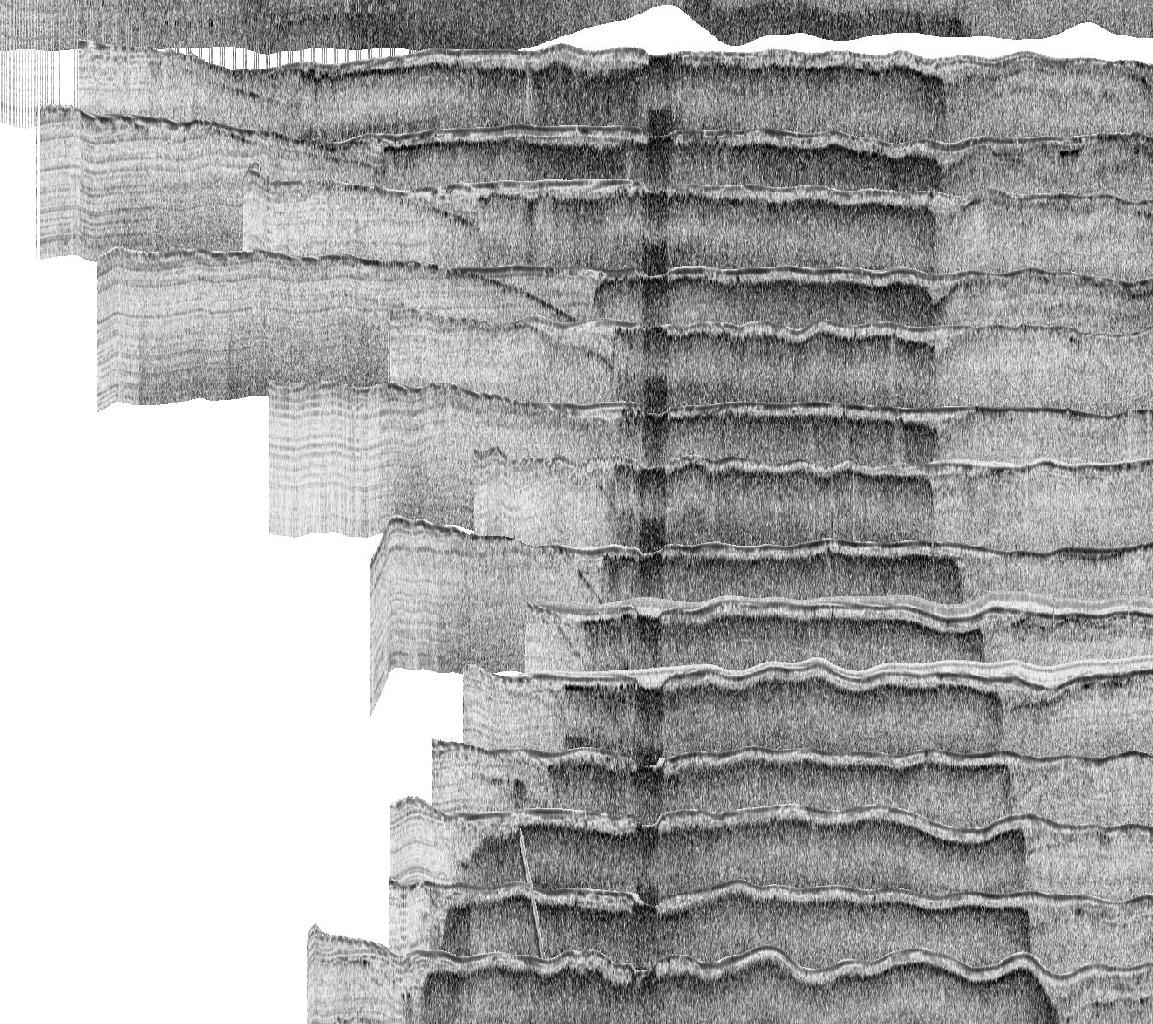 3.5 kHz subbottom across Shippagan dredged channel |
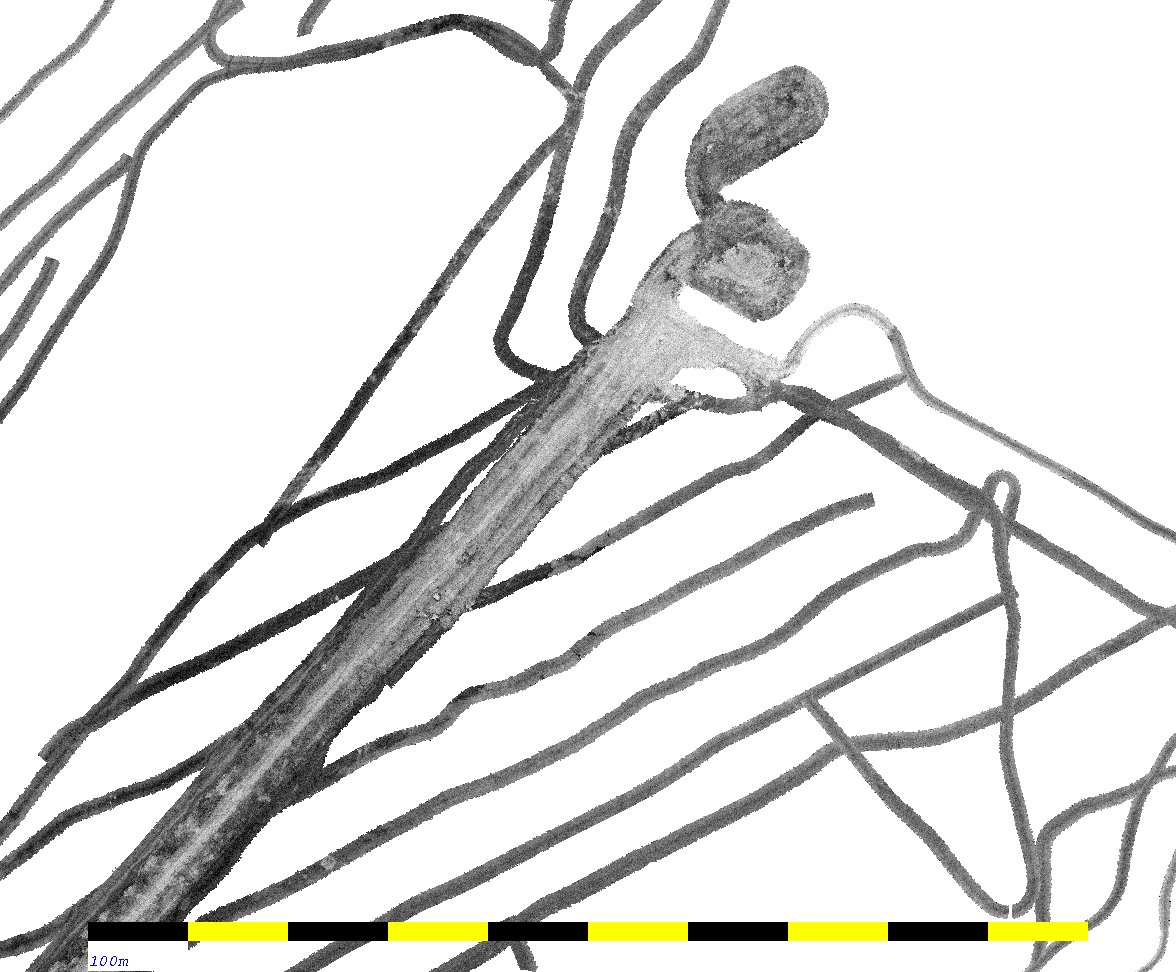
In the vicinity of the dredged
channel NW of Shippagan harbour (Pointe Brule), however, it is
also clear from the subbottom profiling (image to left) that the
dredging has extended down into this gas rich horizon. However, if one
looks at the sidescan image of the same dredged channel (image to
right), one can clearly see that the channel floor is distinctly low
backscatter (as would be expected if it is actively being filled in by
fine grained sediment deposited through current action). Thus, by comparison to the analogous situation in the Shippagan dredged channel, exposure of the gas rich horizon would not be expected to produce a positive backscatter anomaly as is seen in the Lameque Bay dredged channel. In fact if we look at the sidescan image of the outer part of the Lameque channel, it is also low backscatter. |
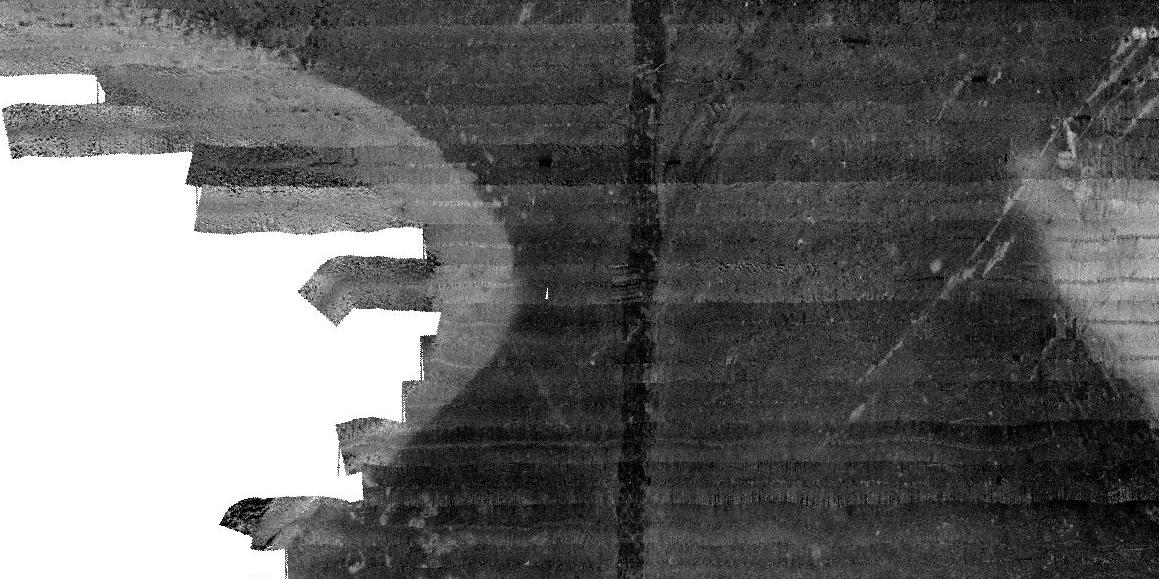 200 kHz sidescan across Shippagan dredged channel |
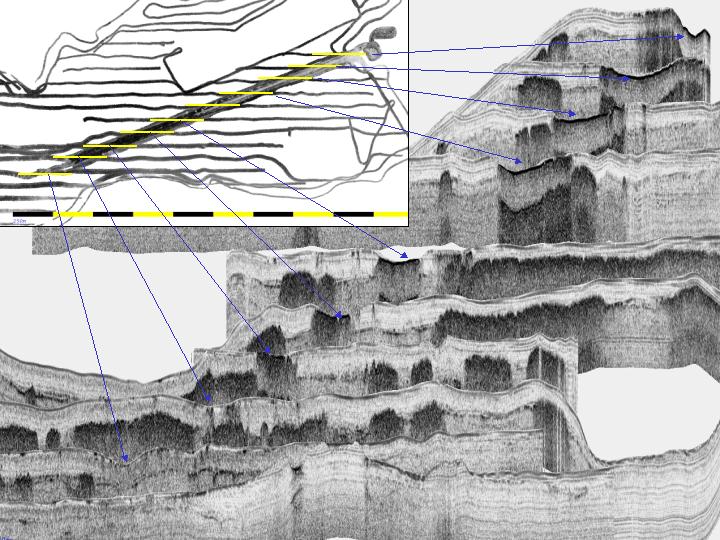 The
adjacent image shows the correlation of the 3.5 kHz transects across
the dredged channel showing that there is a pronounced high
surface reflection coefficient on the channel floor where the
high backscatter anomaly is seen in the EM3000 300 kHz backscatter
images. As stated above, based on the results from the Shippagan
dredged channel, this high reflectivity is not expected to be the
result of exposing the buried gas-rich horizon. It is thus assumed that
the anomaly is due to the presence of an unidentified deposit derived
from fish plant effluent plume.
The
adjacent image shows the correlation of the 3.5 kHz transects across
the dredged channel showing that there is a pronounced high
surface reflection coefficient on the channel floor where the
high backscatter anomaly is seen in the EM3000 300 kHz backscatter
images. As stated above, based on the results from the Shippagan
dredged channel, this high reflectivity is not expected to be the
result of exposing the buried gas-rich horizon. It is thus assumed that
the anomaly is due to the presence of an unidentified deposit derived
from fish plant effluent plume.