Makkovik Bank Survey, Labrador Sea
October 5th-6th 2004
| |
CCGS
Amundsen EM300 Makkovik Bank Survey, Labrador Sea October 5th-6th 2004 |
 |
The MVP 300/1700 is installed in
the fantail of the CCGS Amundsen. The towbody contains a Seabird 911
CTD, from which sound speed information was derived. The towbody
bridle had been damaged earlier in the Arctic field season, which had
restricted the tow speed to 4 knots. A replacement bridle was
transported by OMG staff from BOT and installed. With the new bridle
the towbody was able to collect data at speeds of over 12 knots to
depths of at least 300m. As there were only two survey staff on board during the survey (watches of 1 person). The towbody was not left in automatic control. The towfish was released evey ~ 30 minutes under human observation. The SVP profile was transfered to the EM300 system, with evey second profile being entered in real time. All the profiles are available for post-application with the capability of recomputing steered angles (new surface sound speed) and interpolataion between time-adjacent profiles. |
|||||||||
 |
Prior to arriving at the
Makkovik survey site, the MVP was experimentally deployed at 30
minute intervals whilst steaming in transit up the continental margin at 12
knots. The system cycled to 300m depth for areas with greater depths.
In shallower depths, the towfish was set to recover at a depth of 20m
above the seabed. These data were used to examine the transition from
the Labrador Sea water masses (surface temperatures up to 9 degrees C)
across the edge of the Labrador Current. The transit deliberately extended slightly past the Makkovik survey site at the request of NRCan. |
|||||||||
 |
The Labrador current was
particularily evident with surface salinities of as low as 30.5 ppt and
deeper temperatures as low as 2 degrees C (as opposed to a toasty 9
degrees out in the centre of the Labrador Sea). The front between the
two water masses is very abrupt, occuring within a zone around 10 km
wide. The location of the front is extremely close to the site of the
desired bank survey indicating that the spatial variation in
oceanographic properties were likely to be a cause of concern in the
refraction correction of the EM300 multibeam data. |
|||||||||
 |
Converting the CTD data to
density and sound speed, one clearly sees that the temperature
signature dominates the sound speed structure, whereas the salinity
variations dominate the density field (that in turn controls the
baroclinic component of the circulation). The sound speed varies vertically over ~ 12 m/s within the Labrador current, and more significantly by over 20m/s laterally across the eastern edge of the current. Thus for this survey (and probably any further operations), the sound speed structure will have a significant influence on the achievable vertical accuracy. This in turn will limit analysis of repetitive surveys, looking for evidence of new iceberg scouring. |
|||||||||
 |
Interestingly, standardly MVP
profiles are only taken at intervals of 6 hours or more. Yet the entire
survey area lay within no more than ~2 hours of the location of the
edge of the Labrador current. The same concern will probably extend to
all central and outer Labrador Shelf surveys all the way up to Saglek
Bank. |
|||||||||
 |
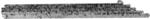
The survey consisted of 9
parallel lines. The SVP data is presented as a function of time, to
illustrate whether there was a systematic variation in the sound speed
structure as a function of time of day. What is most noticeable
however, is that the sound speed structure appears to vary more by
distance, as one moves east-west. |
|||||||||
 |
The C-Nav RTG ellipsoid height signal clearly indicates that the survey was conducted through the local high water period. In addition however, as the local ellipsoid-geoid slope is particularly strong in this area of the Labrador shelf, one can see a zig-zag vertical signal as one moves up and down the ellipsoid traveling east and west respectively. In order to convert this data to mean sea level (MSL), closely approximating the geoid, the 3D geoid-ellipsoid slope will have to be taken into account. The EGM96 model is currently being investigated to perform this transformation. |
|||||||||
 |
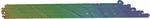
The sound speed data are herein
presented, projected by east-west distance. From this image, it is
apparent that the thermocline was generally deeper to the west and the
deeper water changed quite abruptly at the eastern end of the line. Looking at cross-sections of the initial real-time refraction-corrected data, it is clear that significant (> 2%) refraction artefacts are present in the +/-60 degree swath data towards the end of each line (the real time SVP's were only entered at the start of line). The data will have to be re-processed using the high density MVP data and include interpolation from one watermass to the other. |
|||||||||
 |
|
|||||||||
 |
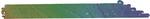
The figure to the left shows a
close up of a N-S section across the survey. One can clearly see
the sensitivity of the data to seastate.
It is particularily noticeable that the data is worse steaming to the east when the seas (from the SE) are coming at the starboard forward quarter. It should be noted that the array is actually on the port side of the hull tilted 6 degrees to port. Lines in which the seas are on the port rear quarter are significantly better. |
|||||||||