Background:
The Grand Manan archipelago is a series of islands located at the mouth of the Bay of Fundy.
It is part of the province of New Brunswick, Canada.
The Grand Manan archipelago is a region with shallow waters and many rocky outcrops.
The shallow waters in the archipelago combined wtih the large tides in the Bay of Fundy result in a complicated pattern of very strong tidal currents.
This in itself makes the Grand Manan archipelago an interesting area to model but oceanographic surveys conducted by the Ocean Mapping Group (OMG) in the summer of 2007 have shown that sand banks exist in the wake of many of the islands in the archipelago.
We wish to use the results of a numerical model combined with a sediment transport model to understsand the formation of these dunes.
Model:
The Grand Manan archipelago is an area with shallow waters and large tidal amplitudes.
For these reasons, it has many intertidal areas.
In order to properly model these intertidal areas, QU_DRY ( Greenberg et al. 2005), a wetting-drying version of the coastal ocean model QUODDY ( Lynch et al. 1996 ), was used.
QU_DRY is a three-dimensional finite element model shelf circulation model.
One of the advantages of using a finite element model is that it allows variable grid resolution.
Bathymetry:
Bathymetric data for the Grand Manan model was obtained from three differenct sources.
In July 2007, the Ocean Mapping Group surveyed the waters to the south of Grand Manan Island providing a high resolution data set of the bathymetry in this area.
In addition, data was obtained from the Canadian Hydrographic Service (CHS).
Finally, for waters which were not covered by either the OMG or CHS data sets, the bathymetric dataset for the Gulf of Maine (by E. Roworth and R.P. Signell ) was used.
The model of the Grand Manan archipelago includes the main island (Grand Manan Island) along with 19 other islands.
The coastlines for these islands were obtained from Service New Brunswick.
These islands are contained within the model boundaries which lies completely in water (see image above right).
A triangular grid for the modelled area was created using the mesh generating program Resolute and refined using the program Genesis.
The resulting mesh has 18,452 nodes and 35,573 triangular elements with element sizes ranging from 167m2 and 77,236m2.
Boundary Conditions:
The outer boundary for the Grand Manan grid is entirely contained within open water requiring the implementation of open boundary conditions. We specify the sea surface elevations along the open boundary nodes. The elevations are obtained from WebTide , a tidal prediction program developed at the Bedford Institute of Oceanography. The Grand Manan Archipelago lies in the region covered by WebTide's Fundy-Maine data set. There are 10 constituents available for this data set: M2, K1, K2, N2, S2, O1, L2, M4, NU2, 2N2. Note that M4 is a shallow water constituent. We used the five major constituents M2, K1, O1, S2, N2. The underlying data sets were interpolated onto the open boundary nodes of the Grand Manan grid to obtain the amplitude and phase along the open boundary for each of the five constituents used to force the model. The model was forced with one constituent at a time and hence was run five times.
|
CLICK ON IMAGES TO ENLARGE
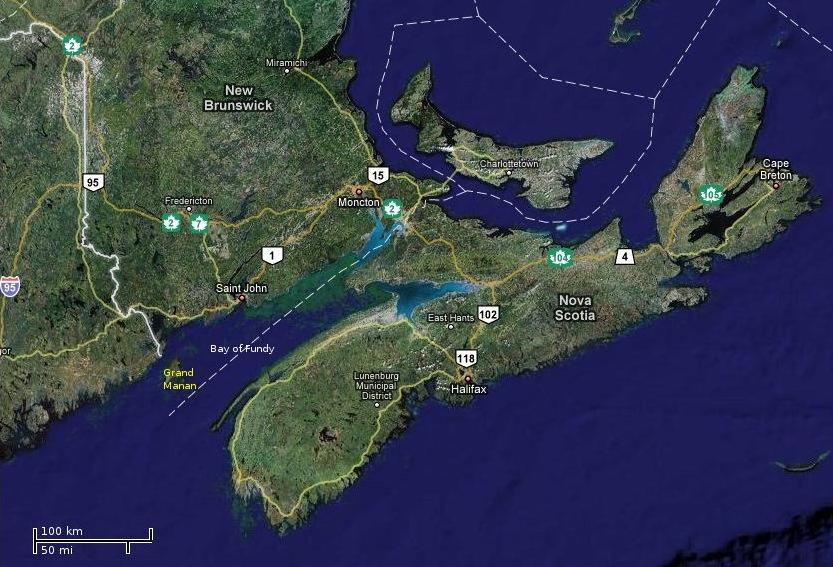
The above image shows the location of the Grand Manan archipelago at the entrance to the Bay of Fundy.
|
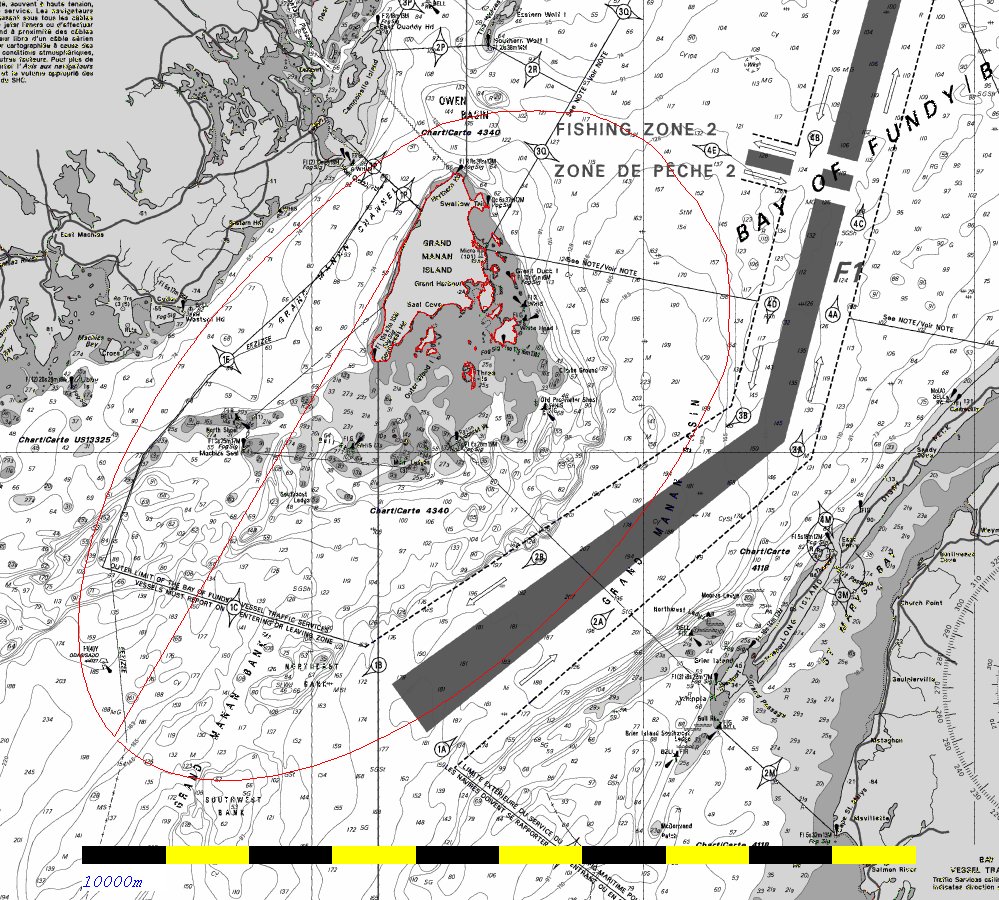
The boundary for the model of the Grand Manan archipelago is shown above in red.
|
|
|
|
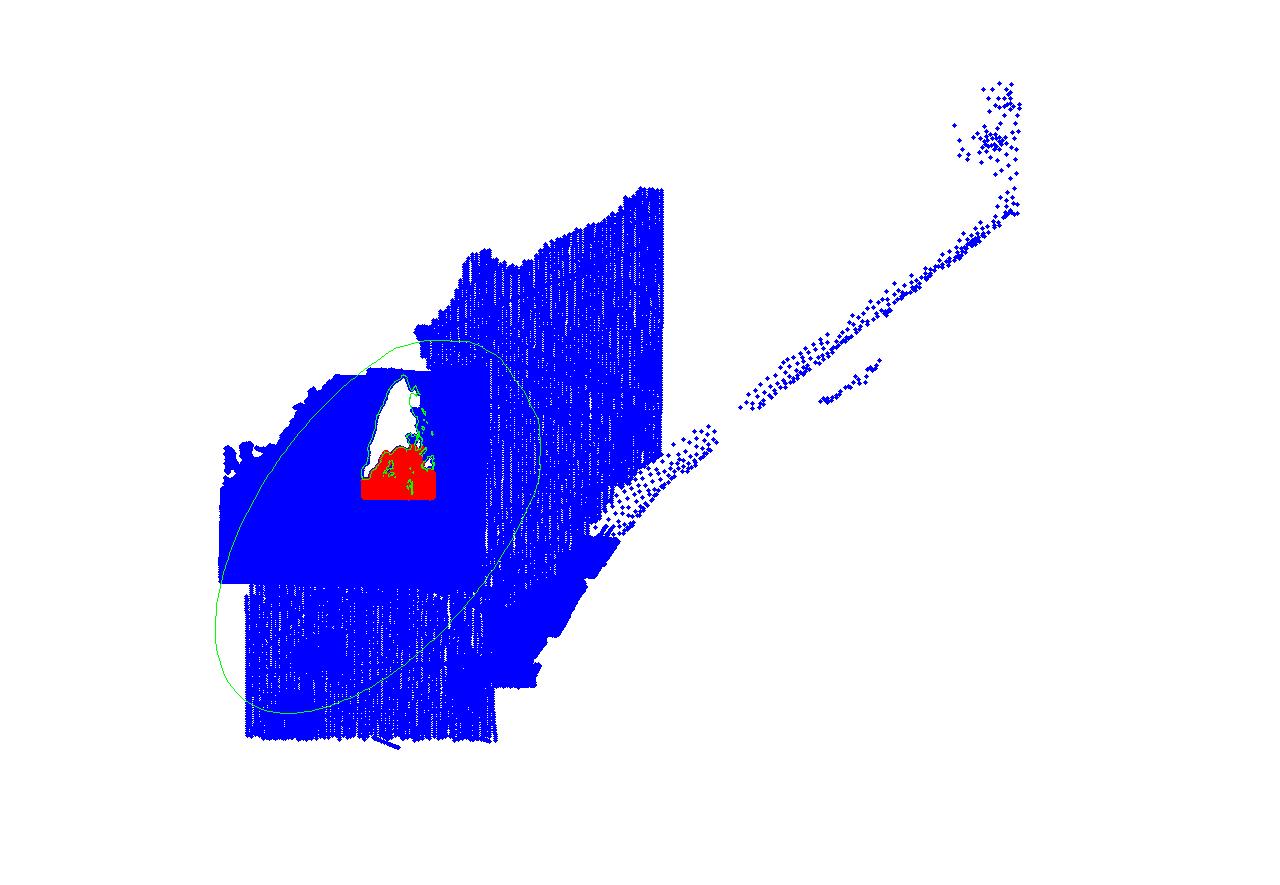
The above figure shows the distribution of the OMG dataset (red) and the CHS dataset (blue).
|
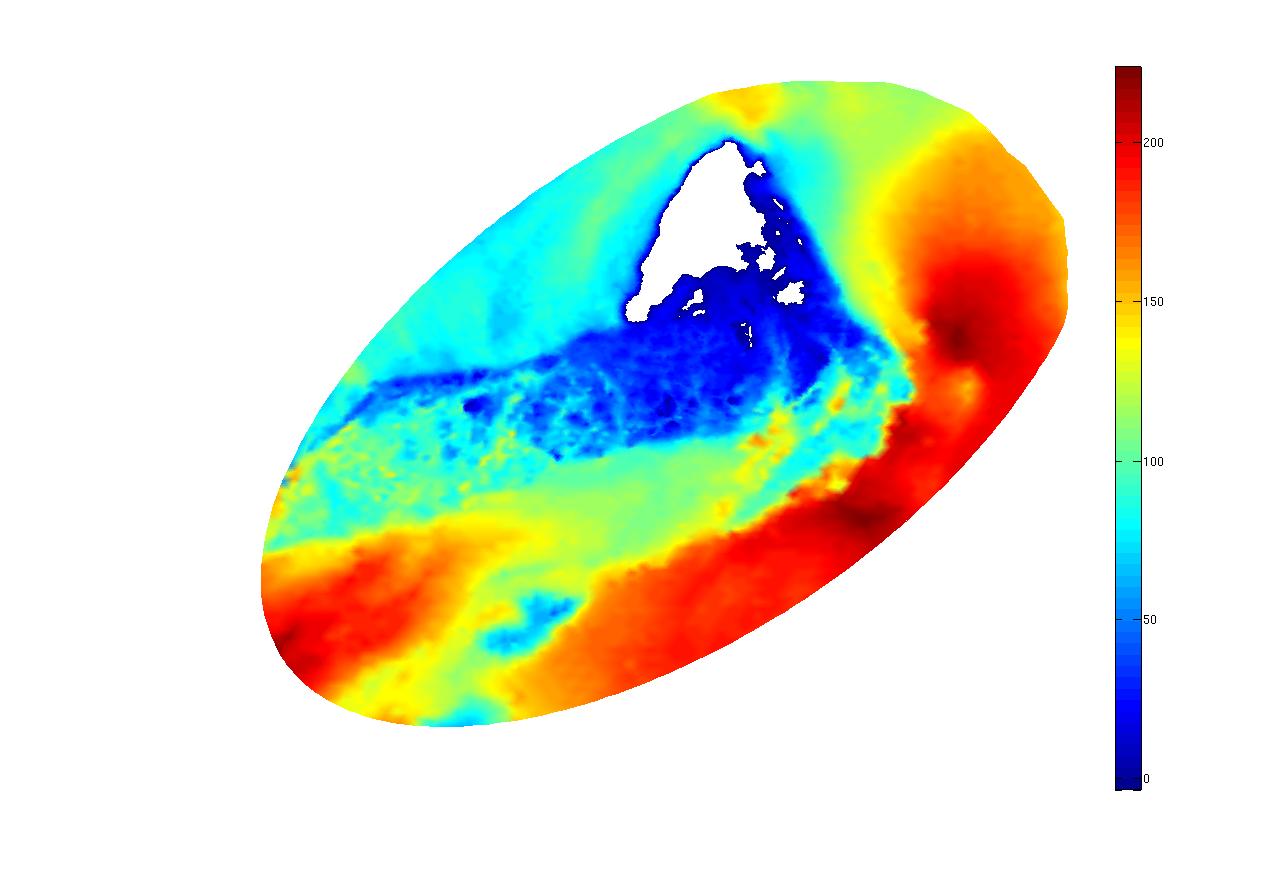
The above figure shows the model's bathymetry which ranges from 3.7m above mean sea level (MSL) to 224.3m below MSL.
|
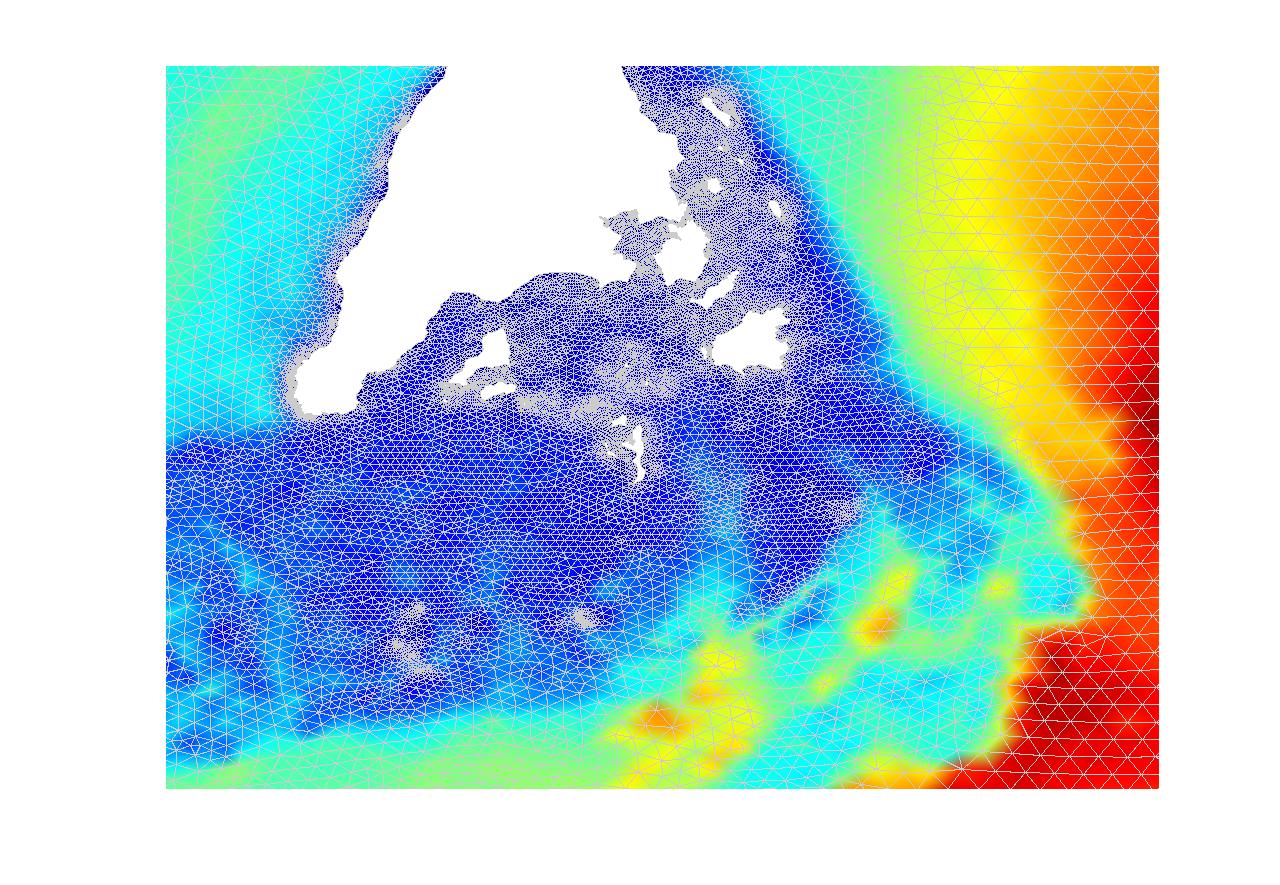
The above figure shows the triangular grid in the vicinity of the Grand Manan archipelago.
|