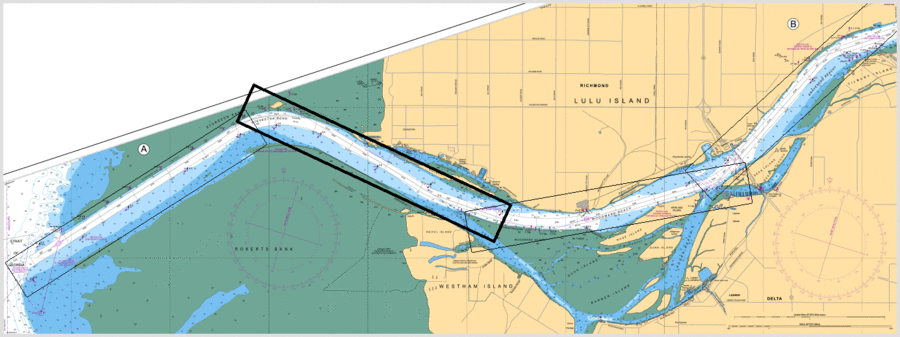
-
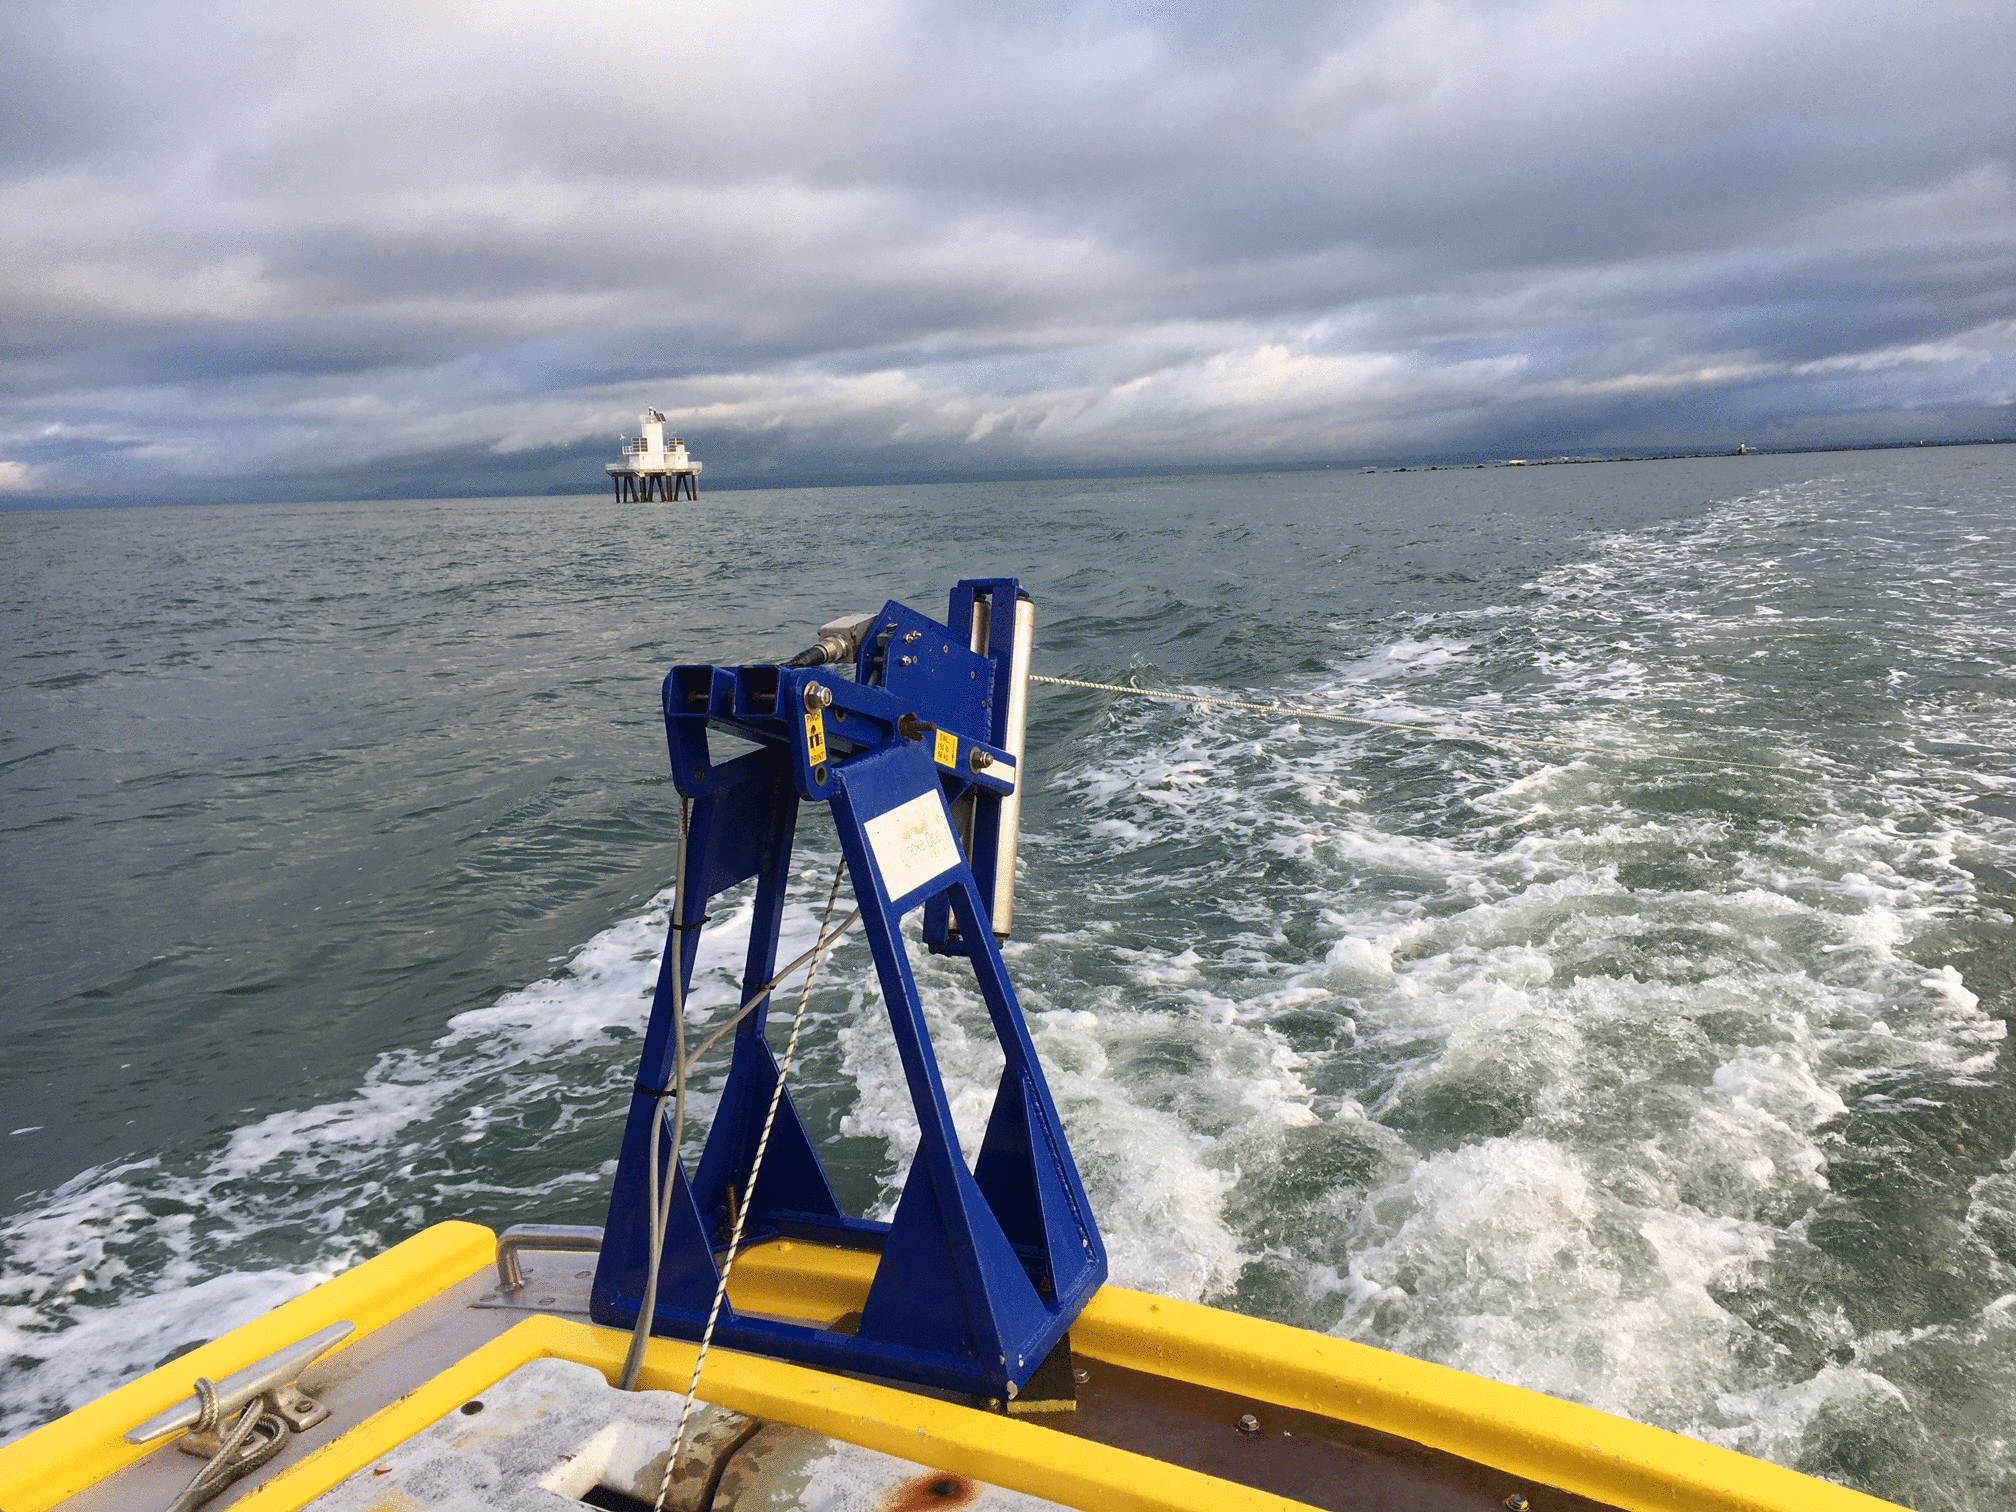
MVP operating beside Sands Head light
|
Imaging
the Salt Wedge
Sands Head to Tilbury, Fraser
River Mouth
CSL Heron, December 14, 15, 16th, 2021
page version Feb.14 2022
|
-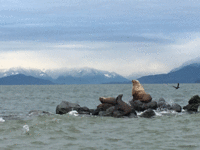
Sea Lions on Sands Head Breakwater
|
data collected by Hughes Clarke and Christie
professionally skippered, as always by Gordon Allison.
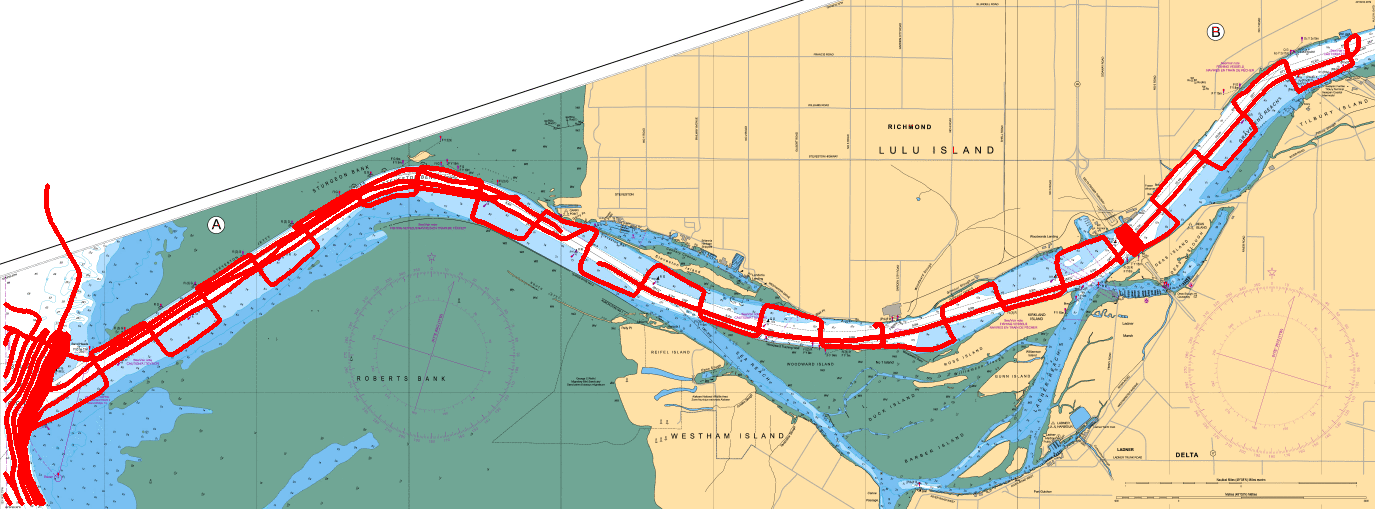
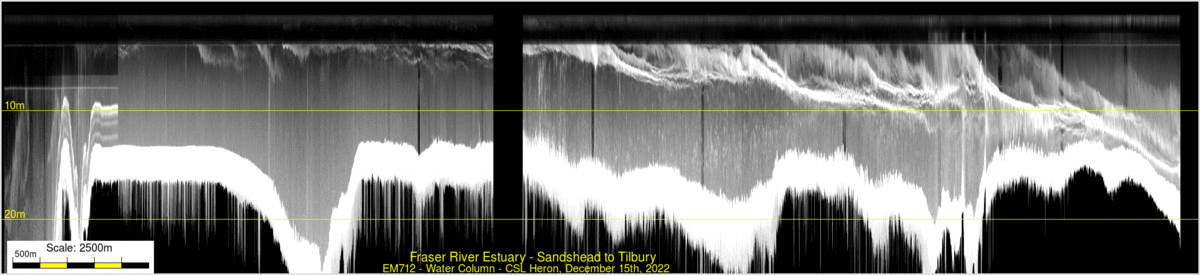
As part of the first field testing of the newly upgraded CSL Heron
sonar suite, an investigation of the salt wedge in the lower Fraser
River estuary was undertaken in mid-December 2021. On December the
15th, an axial transect was undertaken from Sands Head at the lip of
the delta, extending upstream to Tilbury where the nose of salt
wedge was then located. On the return passage, 24 cross sections
were taken orthogonal to the channel axis at one kilometer
intervals. Although a record 100 year flood (~10,700 m3/s) had just passed down the Fraser a
few weeks before, the river discharge had since dropped back to
typical mid-winter low conditions (~1,500 m3/s).
The salt wedge was investigated using a combination of acoustic
imaging and mechanical, underway sampling. The EM712 (70-100 kHz),
the EM2040C (250-350 kHz) multibeams were used to
simultaneously image the volume scattering variability. A Brooke
Ocean MVP-30, equipped with a CTD and two optical backscatter probes
was used to groundtruth the salt wedge and sediment dynamics. While
not installed for this deployment, the future intent is to add a 600
kHz RDI Monitor ADCP for June 2022 operations.

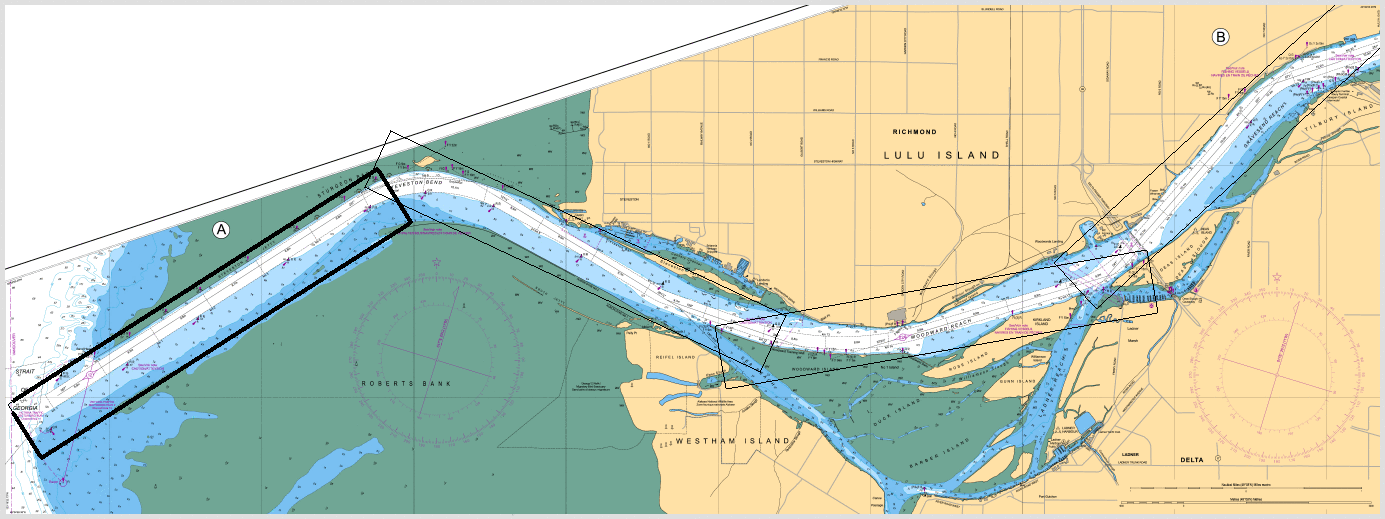
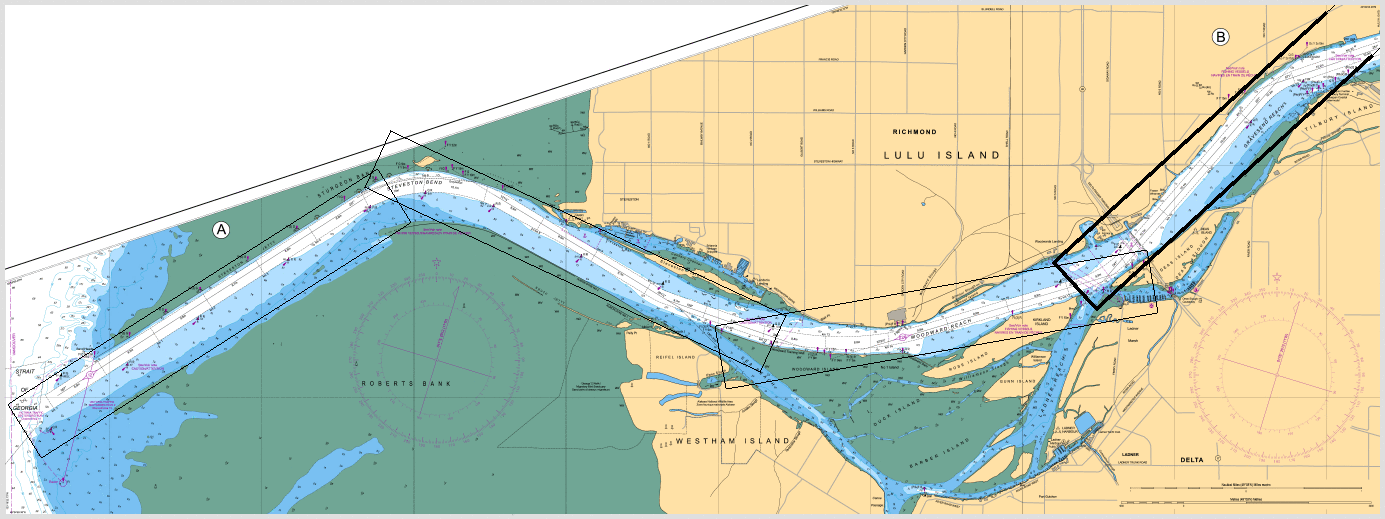
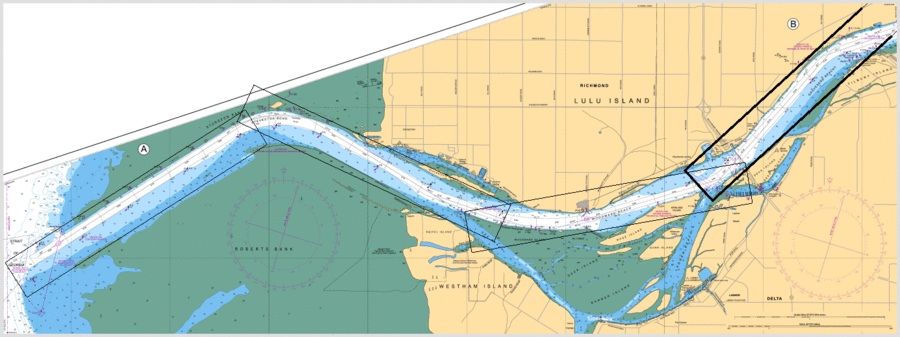
track plot- all 3 days, showing prodelta survey,
longitudinal section and the 24 cross sections.
EM2040C view - December 15th (JD349)
section right of gap were acquired in morning, left of gap in
the afternoon.
EM712 view - December 15th (JD349) - Note that the EM712
above 3m is partly masked by the sector firing delays
note at left edge - using dual swath - so sector delays twice
as long - most of the line uses single swath only
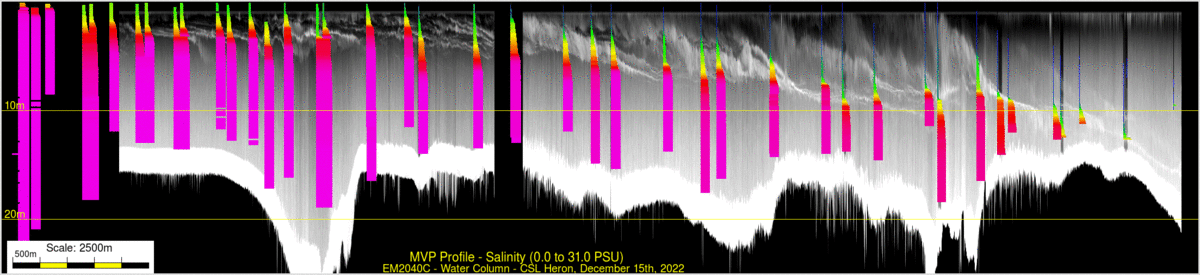
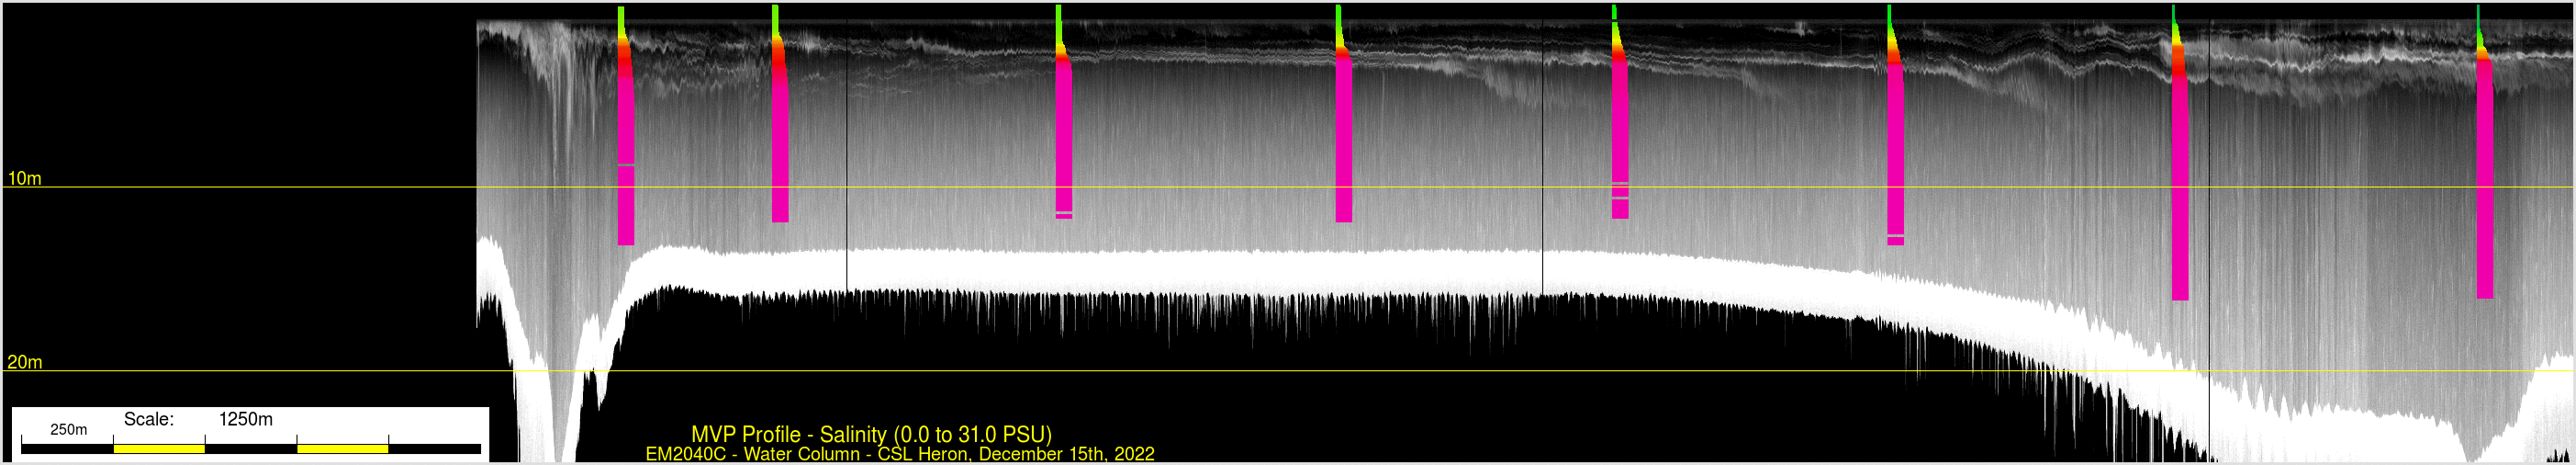
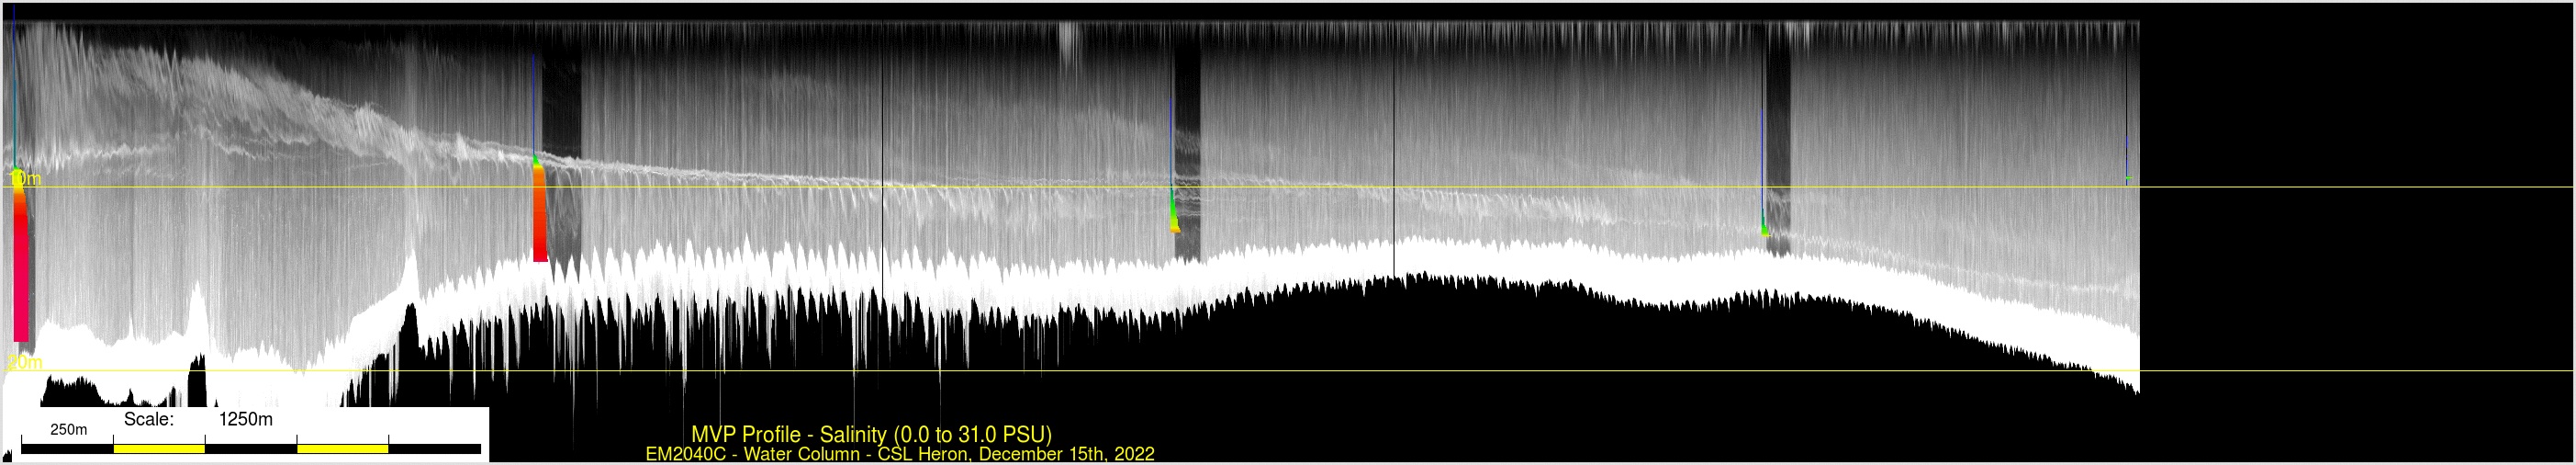
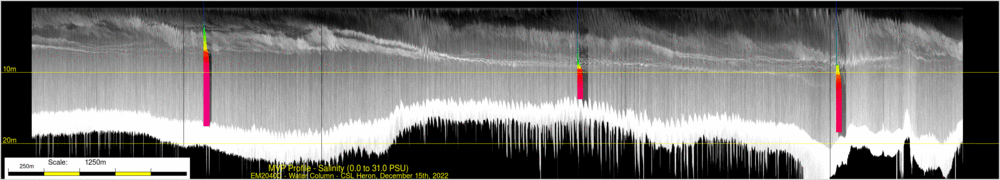
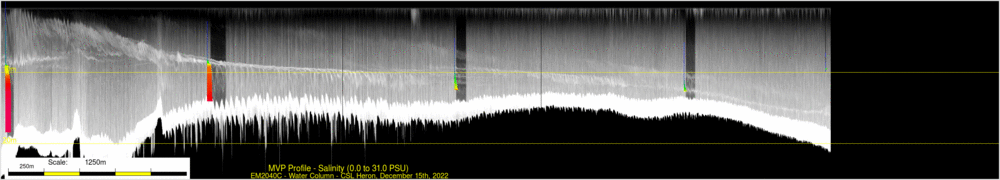
All Salinity MVPs (0-31 ppt) collected on 15th December,
projected along the length of the channel
Note that ~ 1/2 the dips were taken at a time other than the
background EM2040C image (mainly while acquiring the cross
-sections) so at a different phase of the tide.
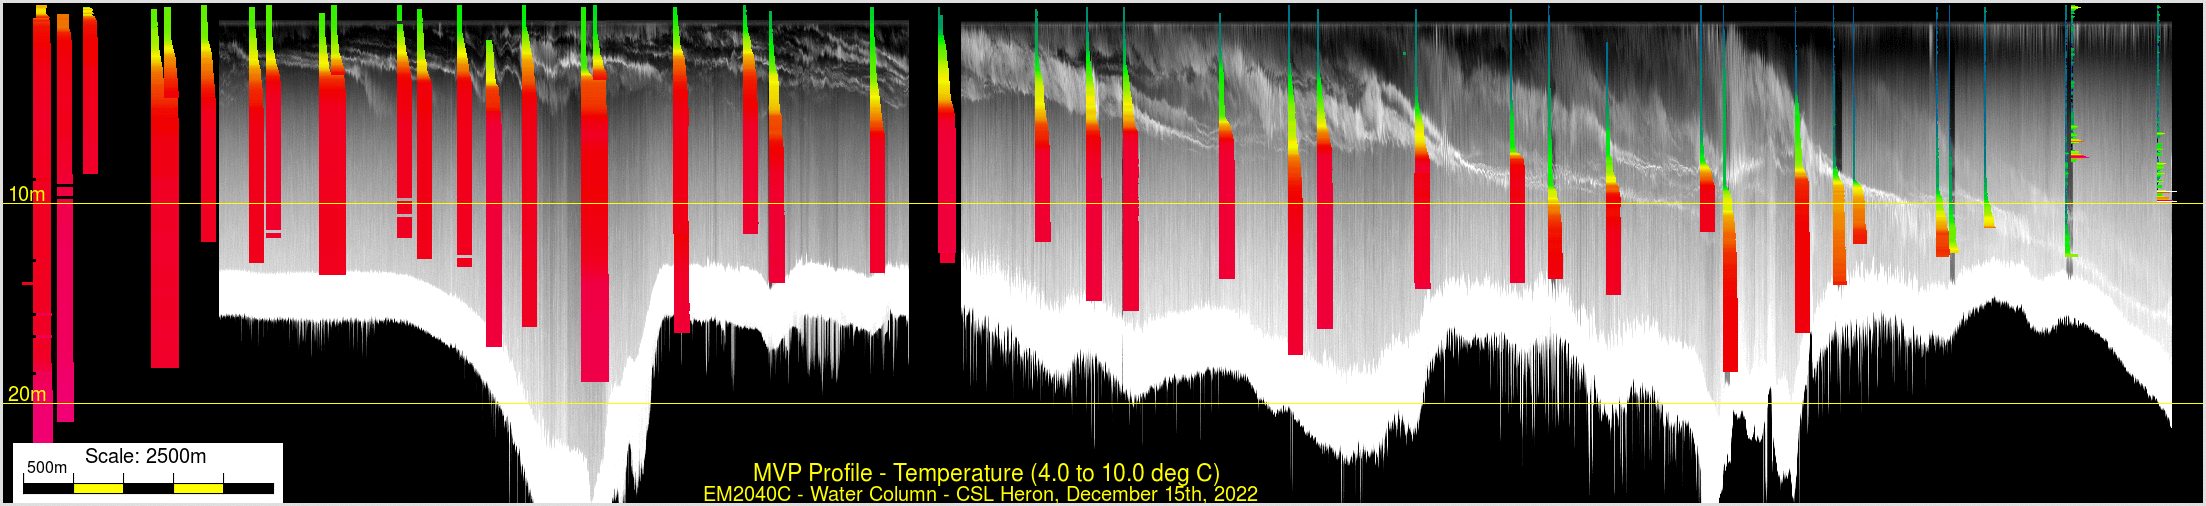
 All Temperature MVPs
(4-10 dep C) collected on 15th December, projected along
the length of the channel
All Temperature MVPs
(4-10 dep C) collected on 15th December, projected along
the length of the channel
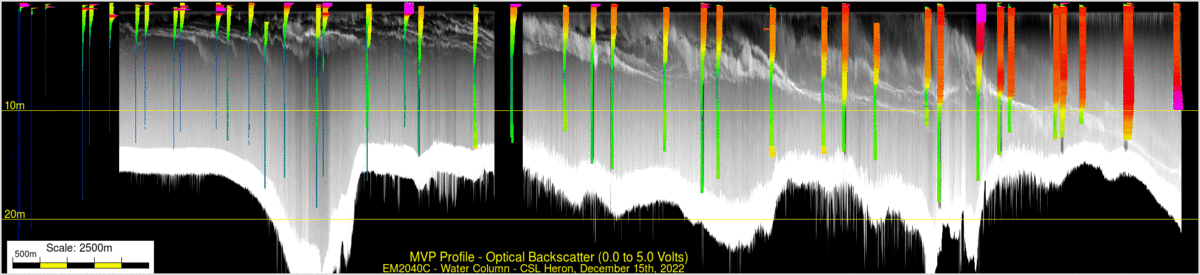
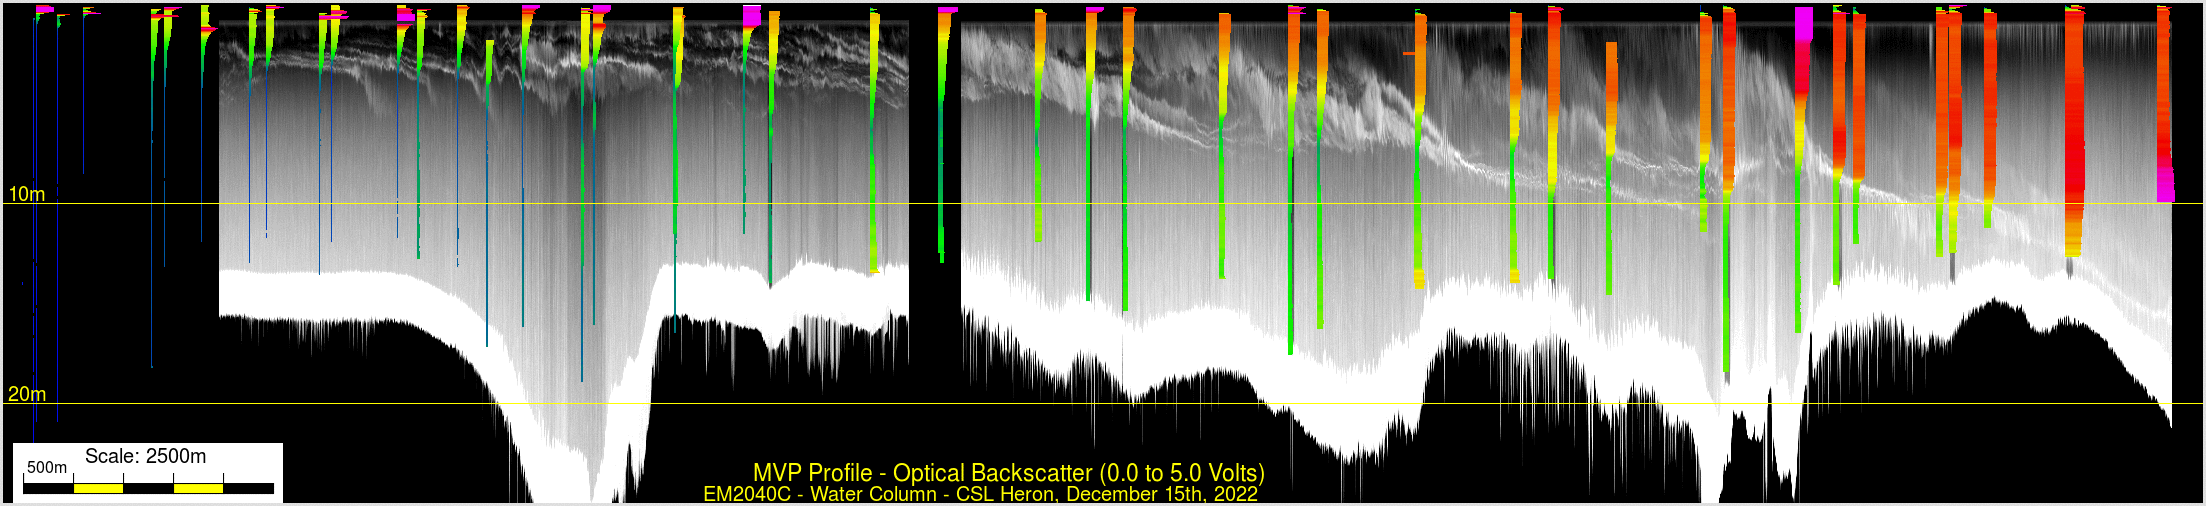
Optical Backscatter (0-5 millivolts) - a proxy for suspended
sediment - all dips on December 15th
As the overview cross section clearly illustrates, at the time of
this survey, the salt wedge penetrated all the way up to Tilbury.
The thickness of the shear horizon (defined by the rapid shift in T
and S) varies and seems to correlate with the width of the
scattering boundary seen in the MB WCD data at the dip
location. The salt wedge is ~ 5 deg C hotter than the
overlying brackish water and does not appreciably warm up as it
penetrates, suggesting little downward entrainment of the overlying
waters (until the salt wedge thins to a few meters off the river bed
at the upper end). In contrast, the overlying brackish plume becomes
progressively warmer and saltier as it goes out to sea suggesting
significant upward entrainment throughout the reach. The highest
suspended sediment load is clearly in the overlying brackish water.
The lower saltier layer is clearest (lowest suspended solids) at the
ocean end and becomes progressively murkier going up stream.
7 km Subsections
For more efficient processing, the ~ 25 km length investigates was
broken into 4 discrete 7 km long sub sections.
Sands Head Subsection:
The first 7 km from the lip of the delta to the
bend.
location
map
|
 |
EM2040C
nadir
curtain
water column
with
simultaneous
MVP salinity
profiles.
|
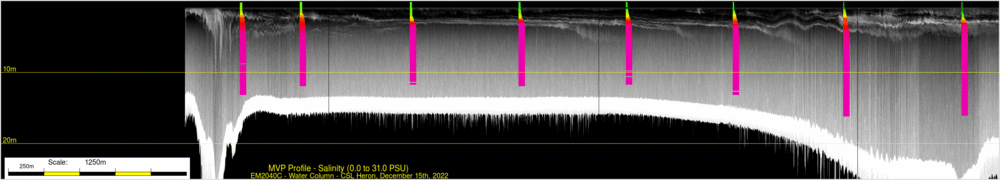
very stable halocline and flat (collected in the afternoon),
suggesting little to no shear.
|
EM2040C
backscatter
bathymetry
|
 |
|
|
EM712
backscatter
bathymetry |

|
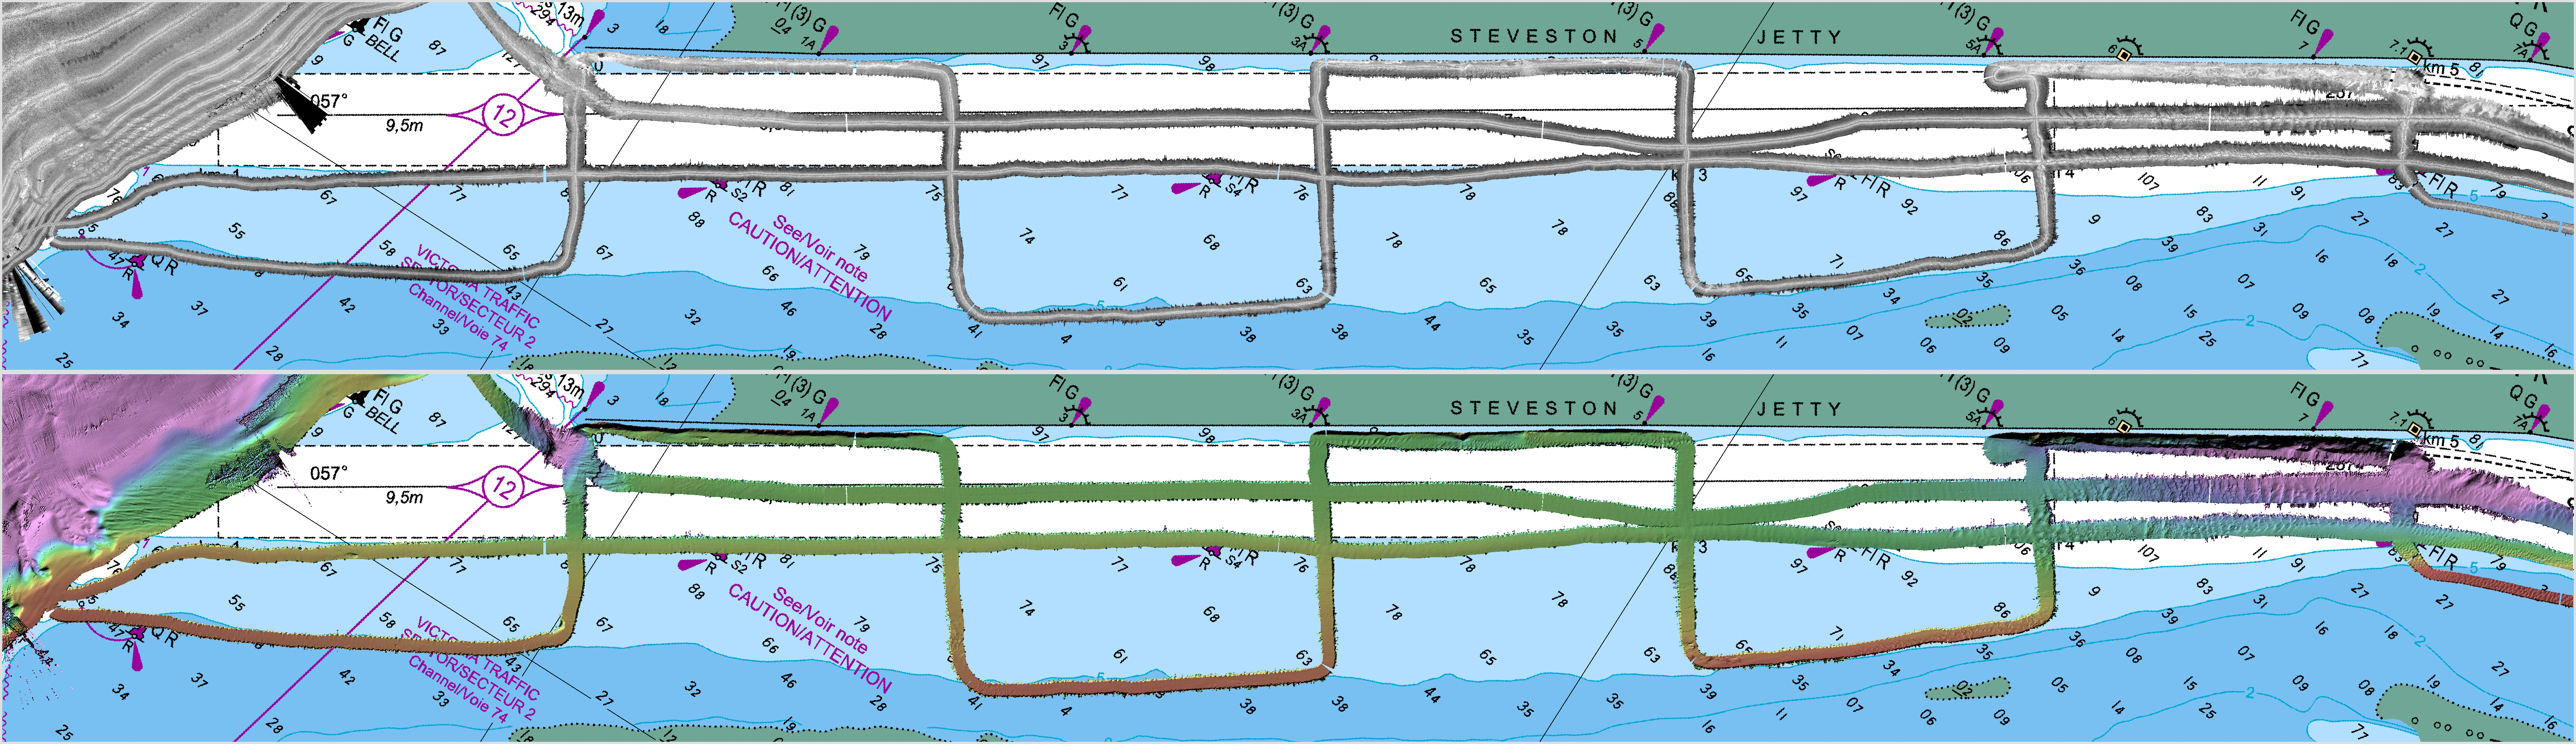
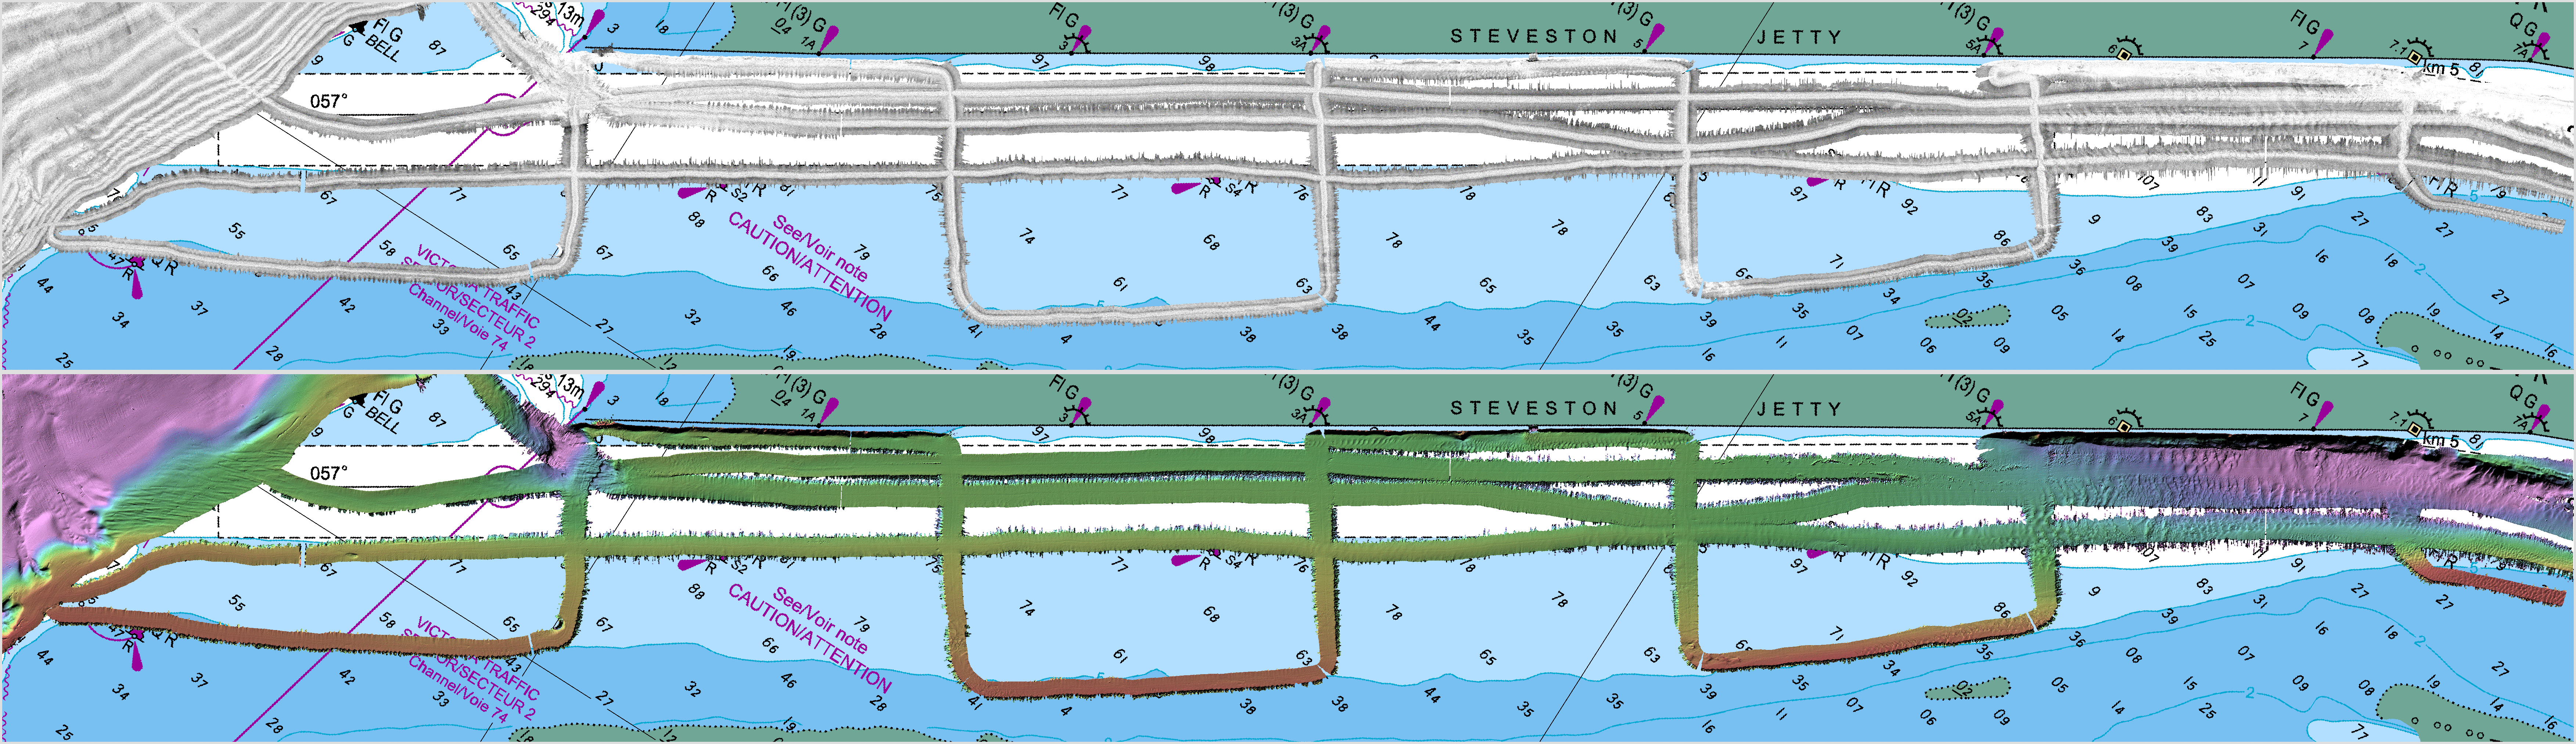
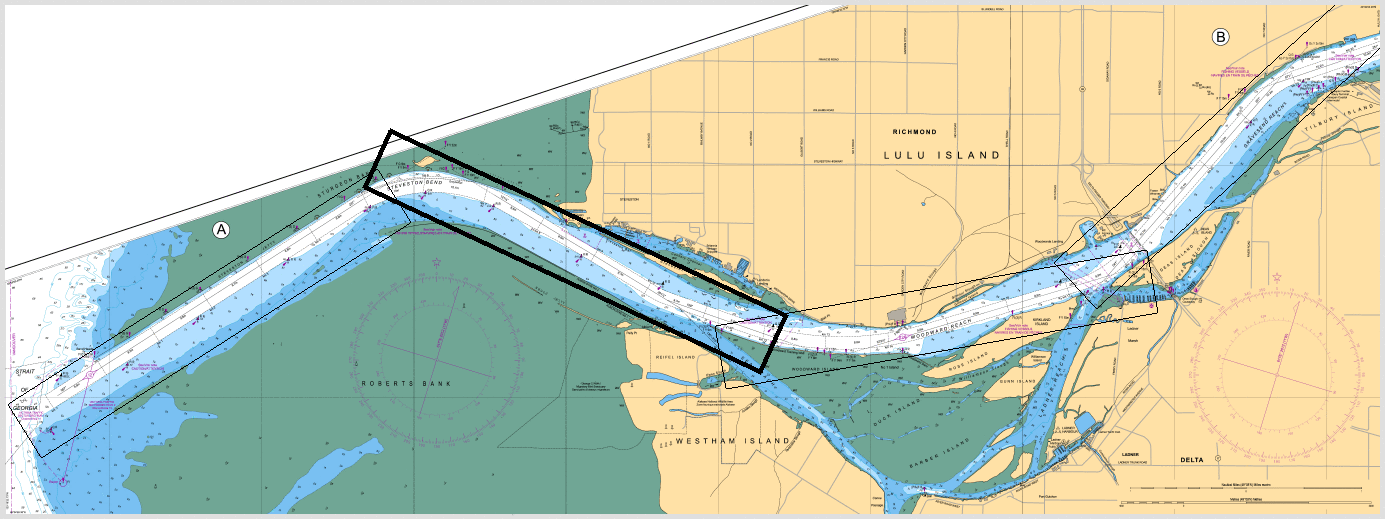
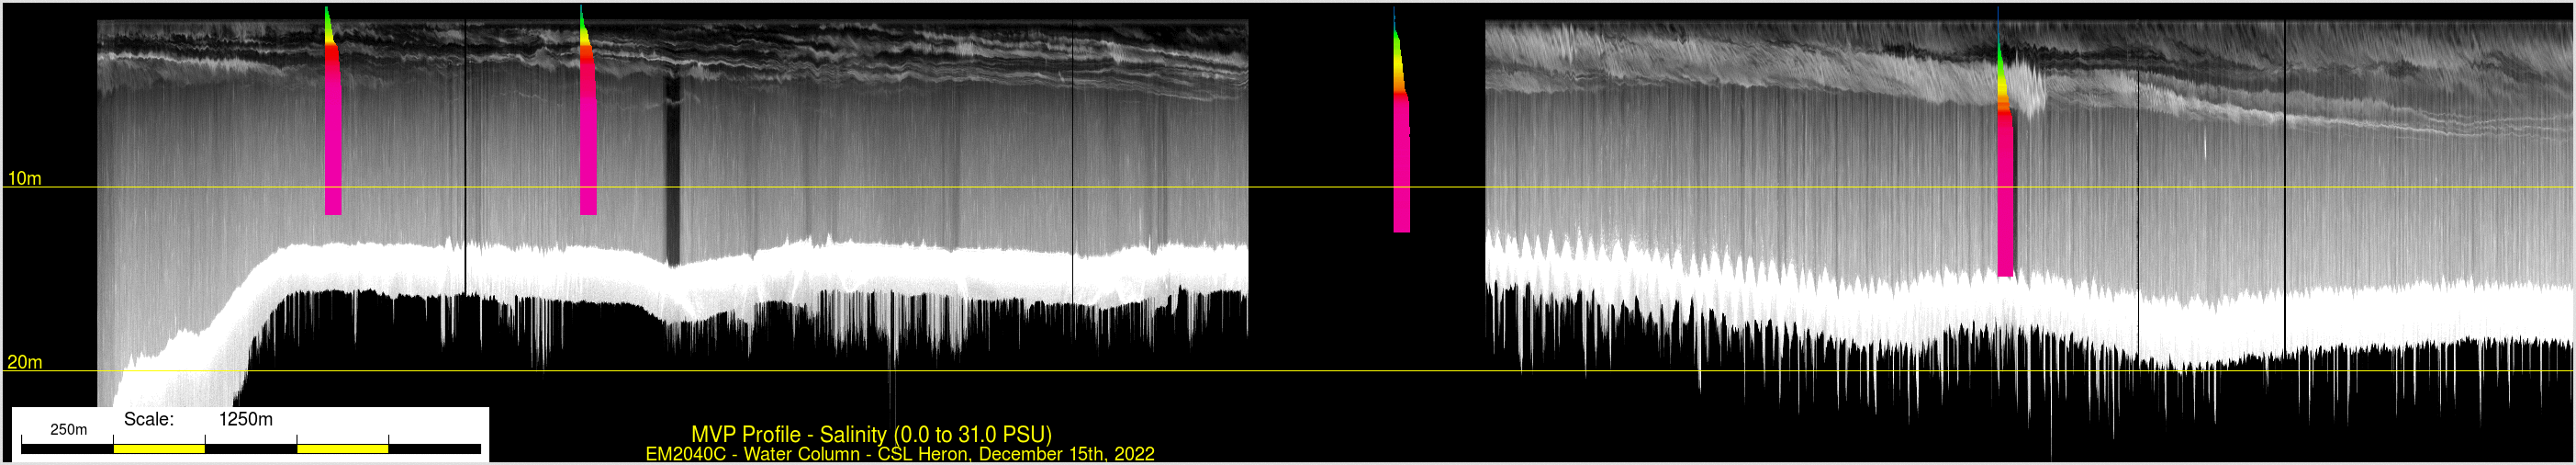
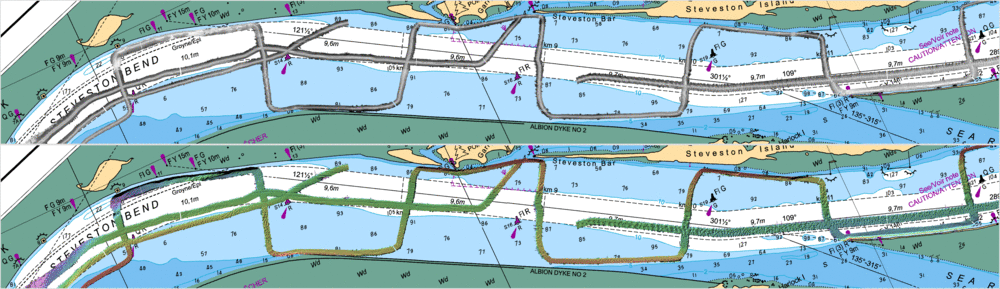
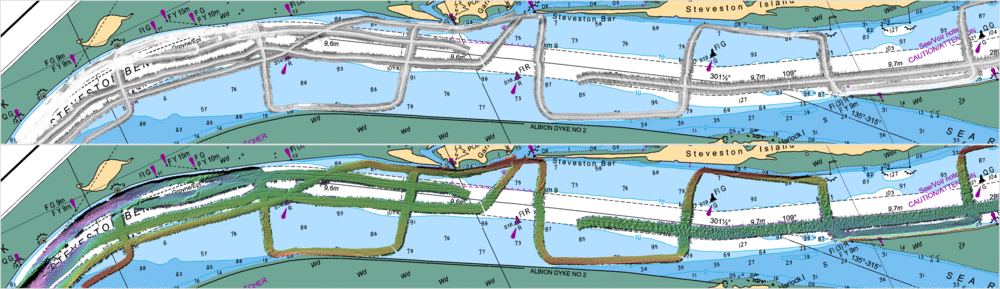
Steveston Subsection:
From the bend to past Steveston.
location
map |
 |
EM2040C
nadir
curtain
water column
with
simultaneous
MVP salinity
profiles. |

Note that the right hand section was done in the morning,
steaming upstream, whereas the left hand section was done in
the afternoon
(again steaming upstream). So there is a significant change
in the phase of the tide. Lots of KH waves in the morning,
but none in the afternoon.
|
EM2040C
backscatter
bathymetry |
 |
|
|
EM712
backscatter
bathymetry |
|
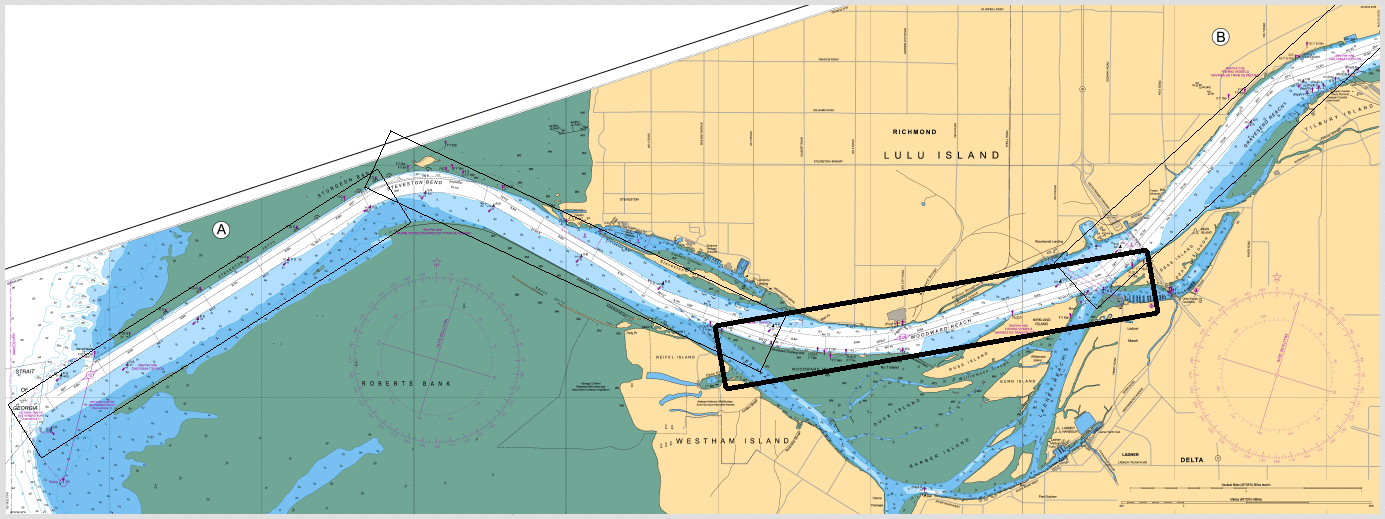
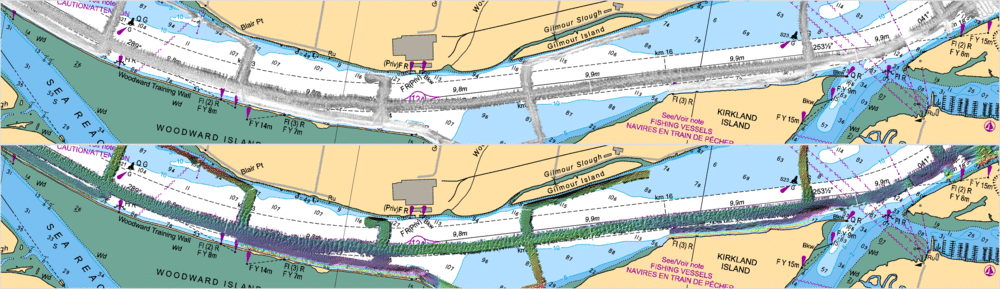
Woodward Subsection:
From the upper end of Steveston Island to
the George Massey Tunnel
location
map |

|
EM2040C
nadir
curtain
water column
with
simultaneous
MVP salinity
profiles. |
notice the sinusoidal undulation of the halocline just as
one point in the middle of this section.
Given what we've now learnt from ship wakes, this is
probably the result of a large passing vessel.
|
EM2040C
backscatter
bathymetry |
 |
|
|
EM712
backscatter
bathymetry |
 |
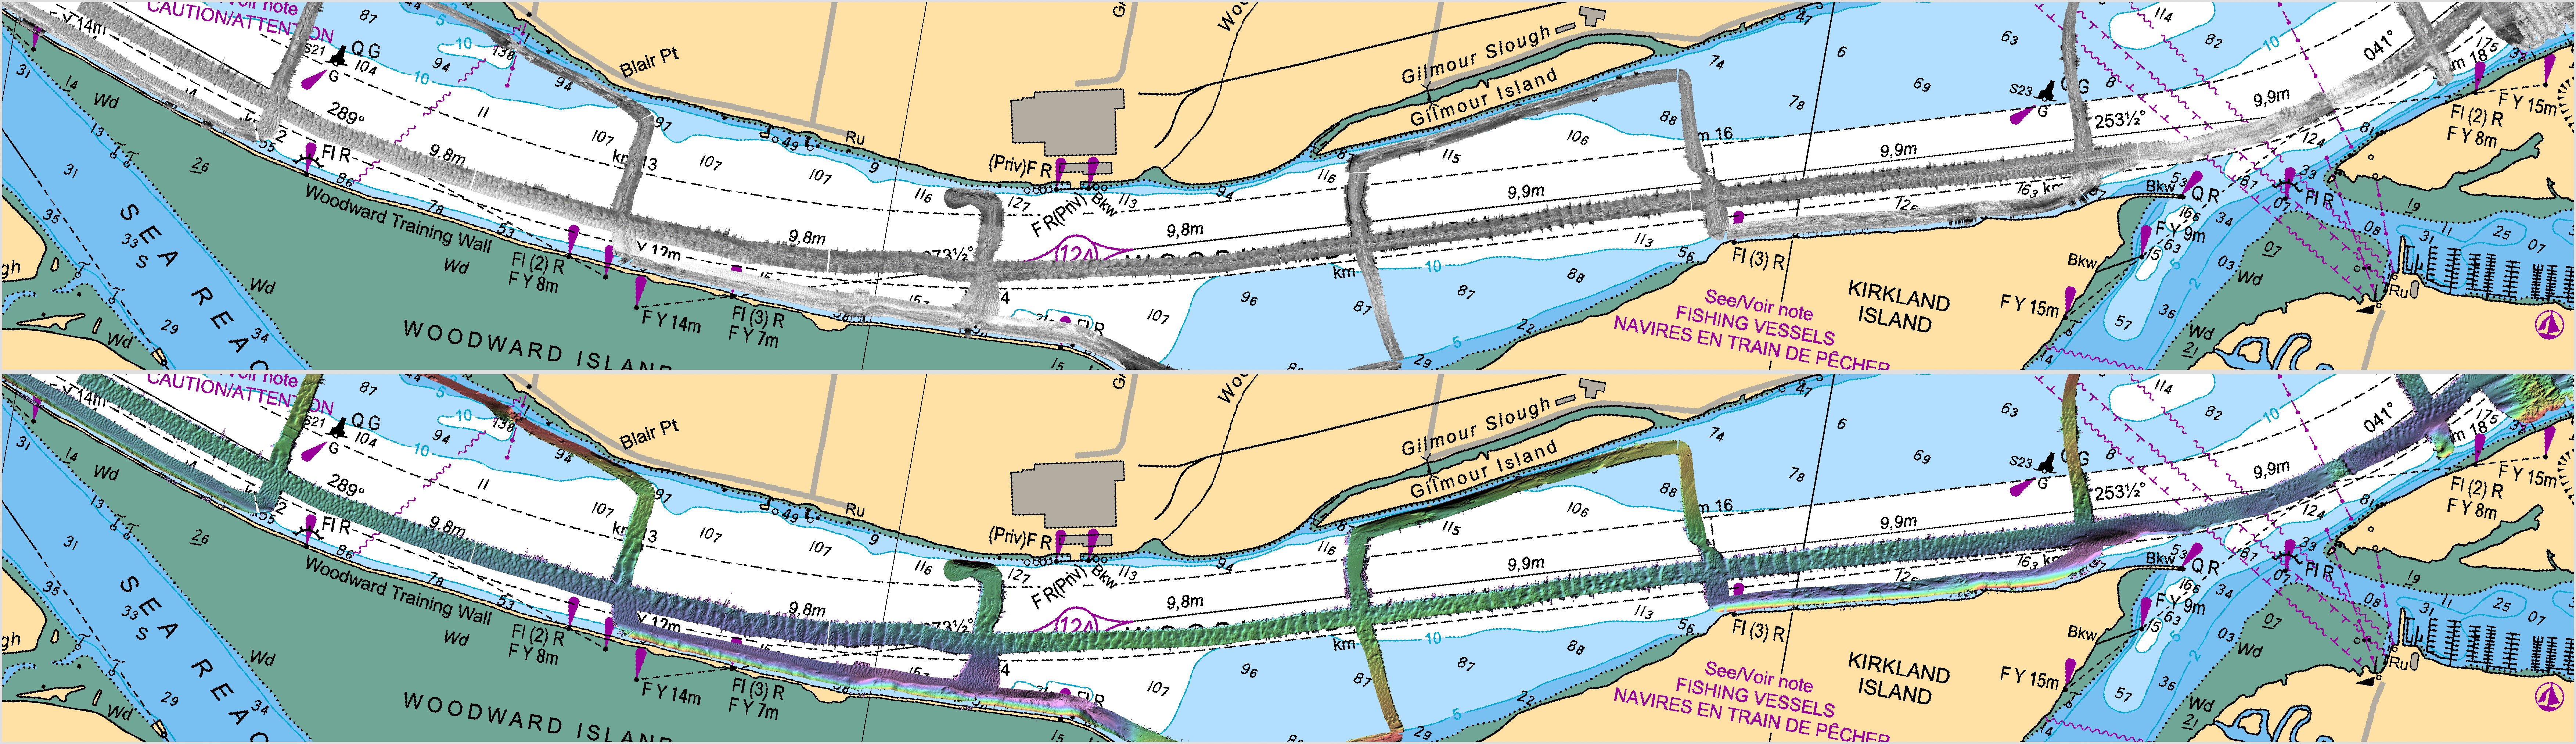
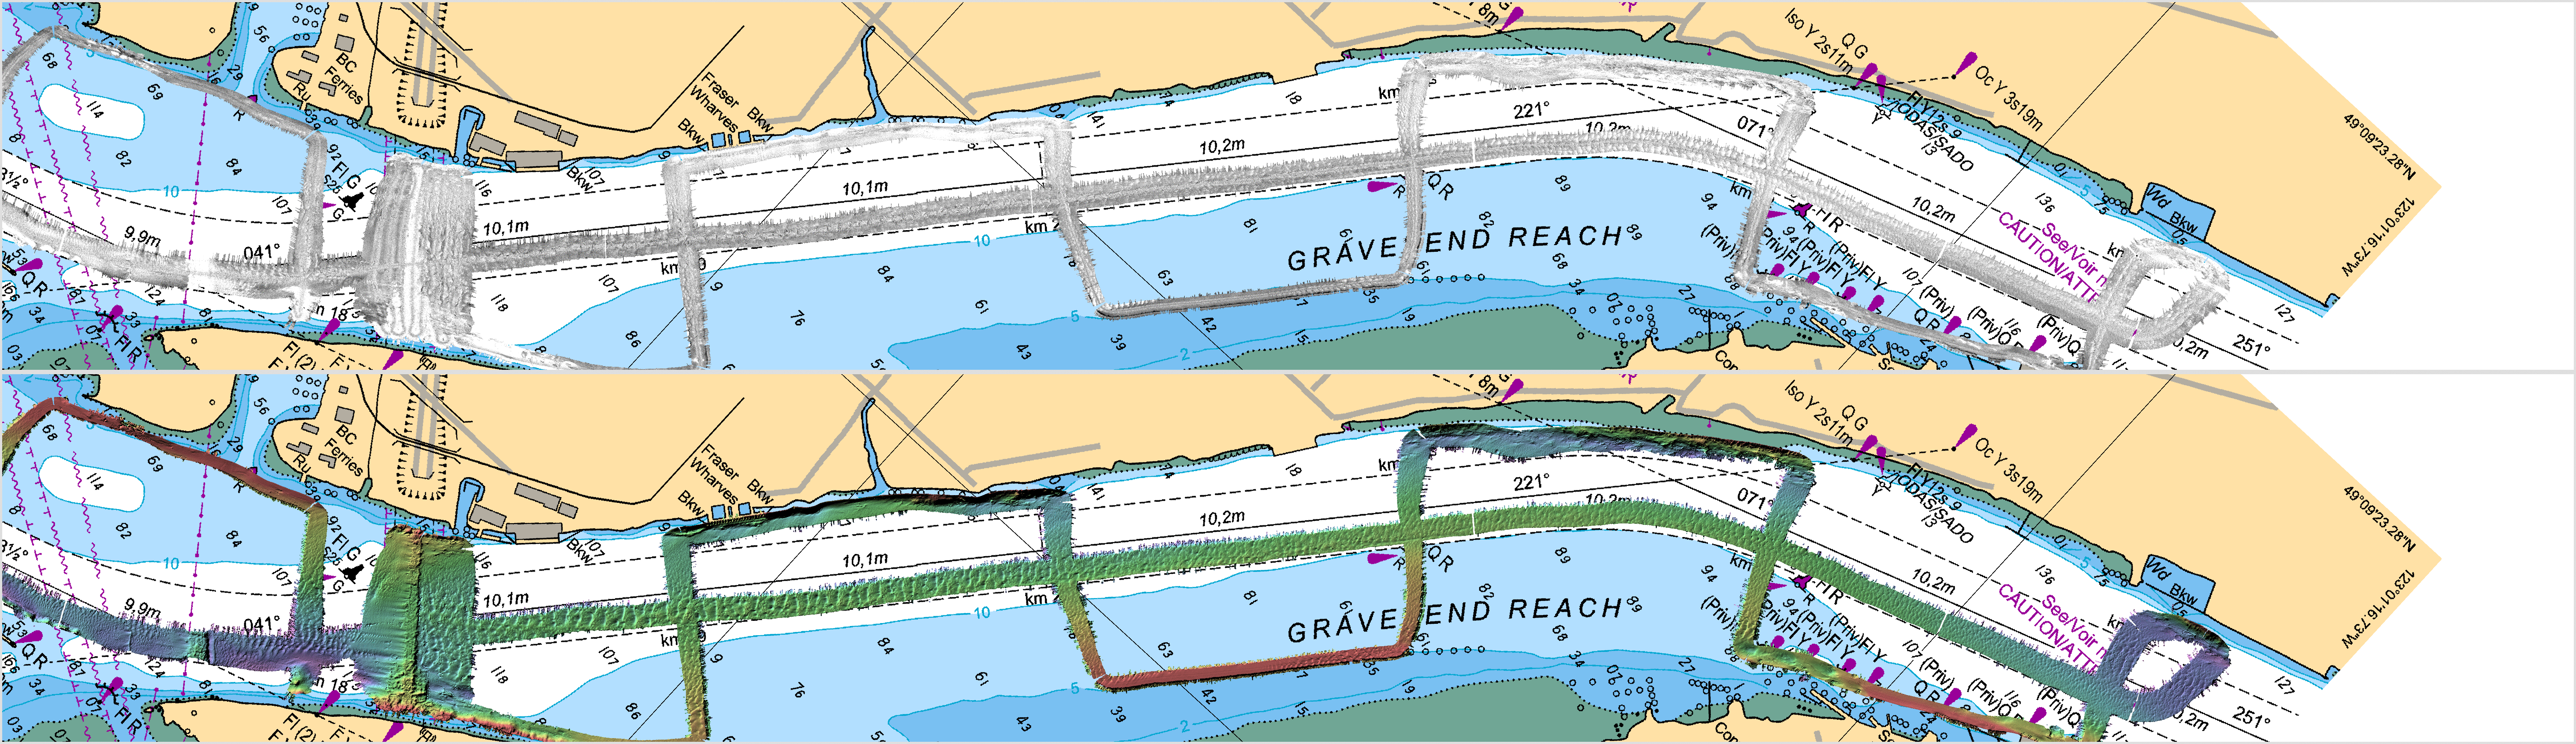
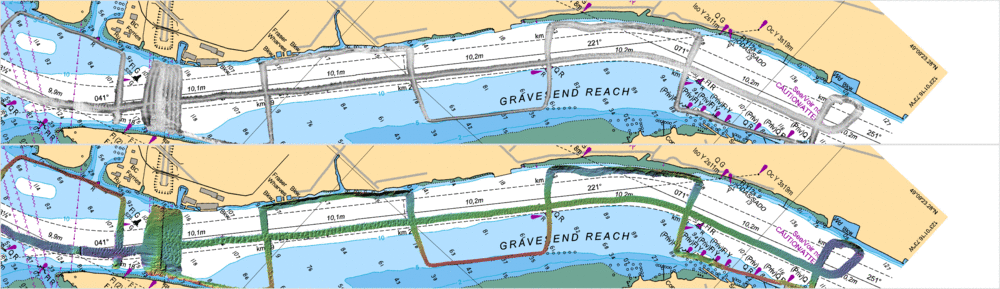
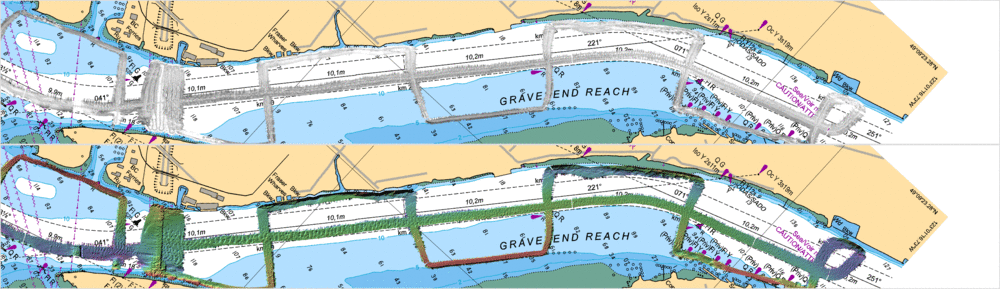
Gravesend Subsection:
From the George Massey Tunnel to the Tilbury
Seaspan Ferry terminal.
location
map |
|
EM2040C
nadir
curtain
water column
with
simultaneous
MVP salinity
profiles. |
At this section, the nose of the halocline terminates just
at the upstream end.
Notice the periodic disturbance of the underside of the
thermocline, corresponding to the
series of larger sand waves situated at the same spacing
below.
|
EM2040C
backscatter
bathymetry |
|
|
|
EM712
backscatter
bathymetry |
 |
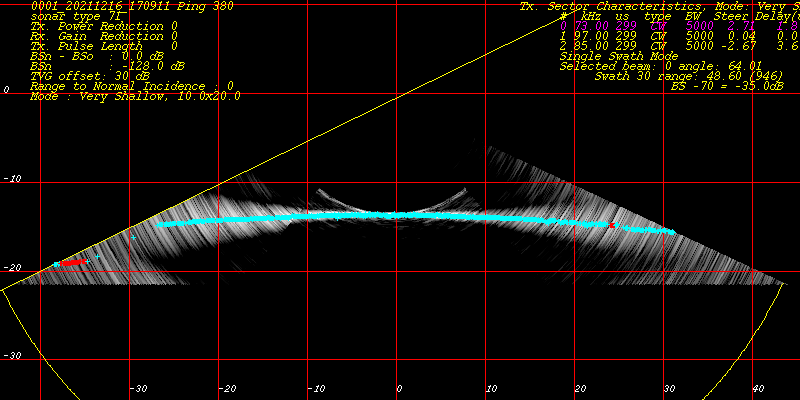
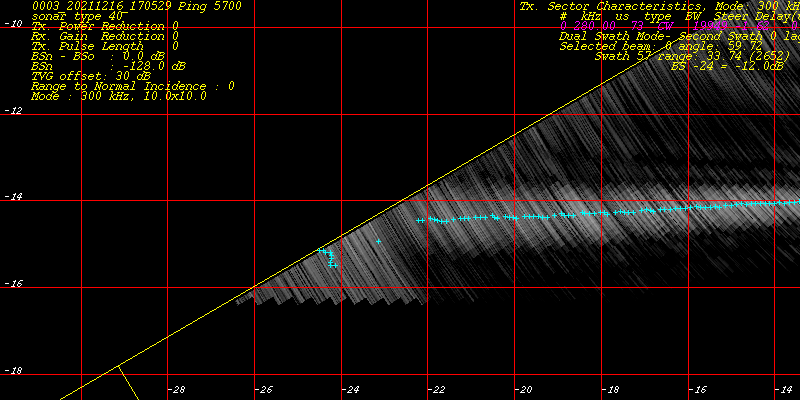
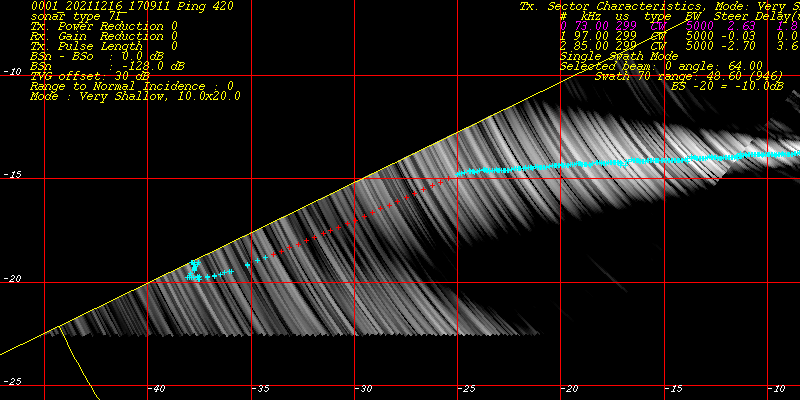
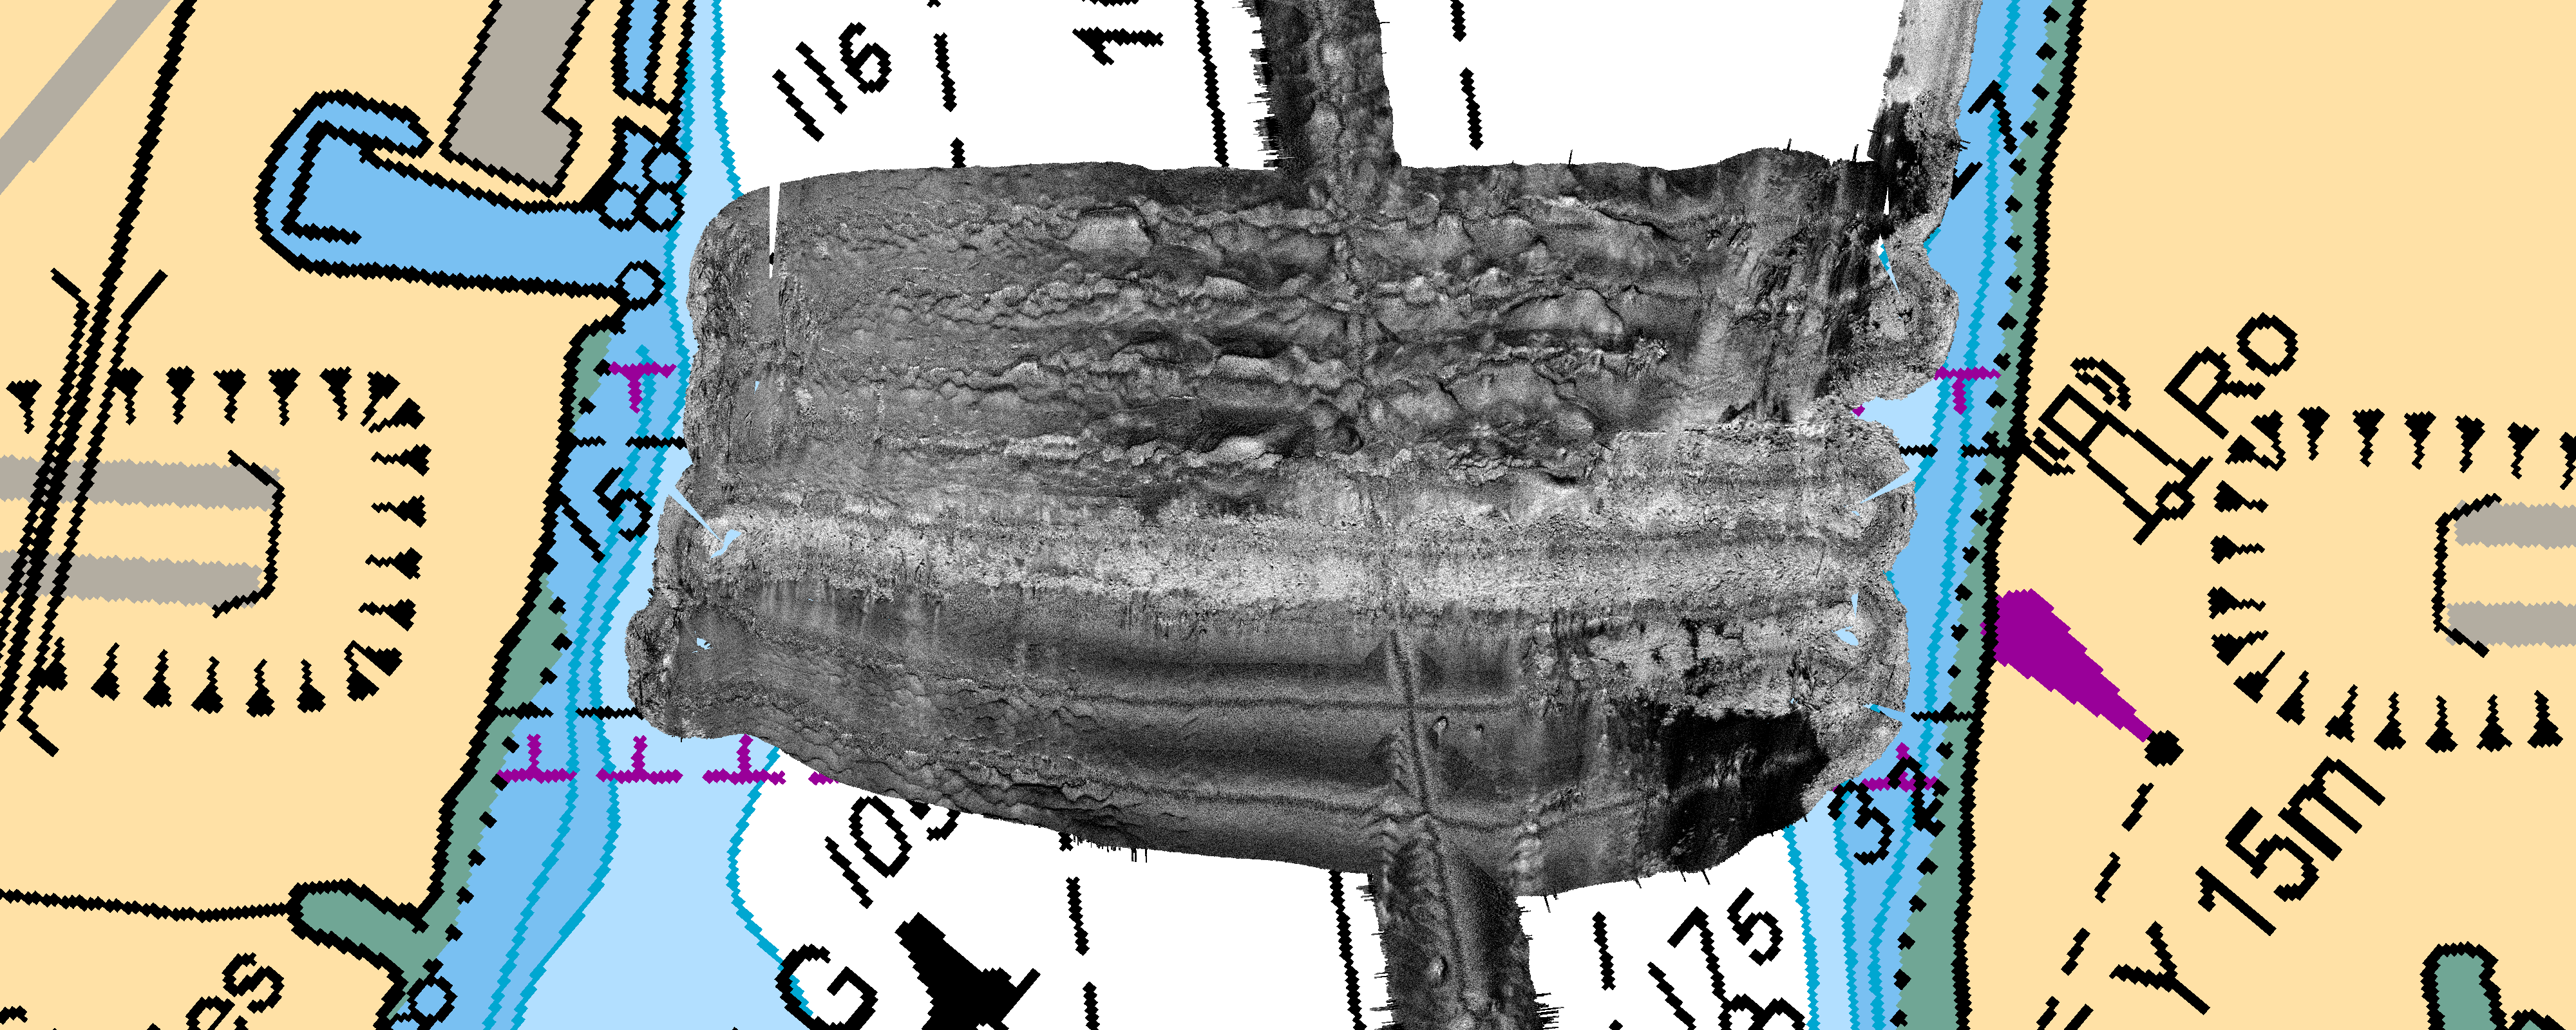
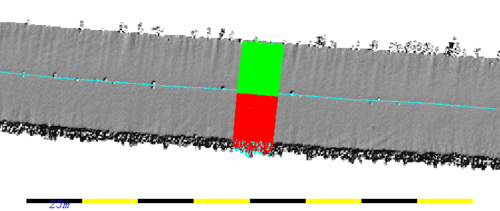
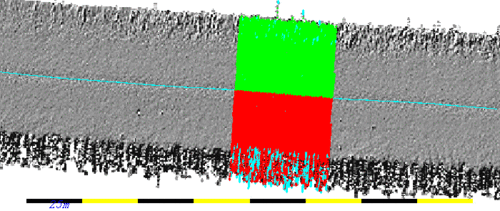
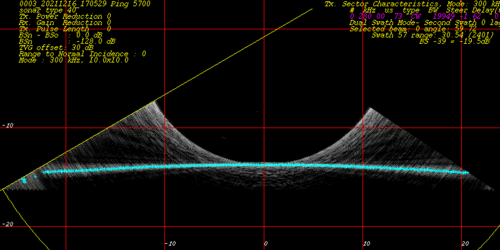
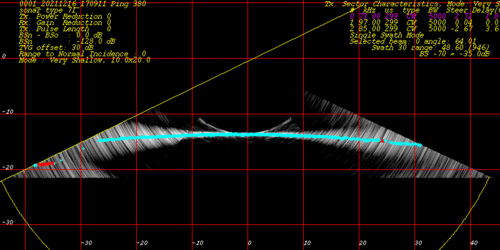
Systematic Mistracking on Port Side
For reasons not currently explained, both the EM204C and EM712
bottom detection has a significant problem in these range of water
depths (5-25m), primarily on the port side. It is clear that the
bottom detection algorithm, after 60 degrees, is preferentially
locking onto the direct multiple echo. As this is happening on
both systems, and neither of them have any obstructions on that
side, it is suspected to be a result of a recent modification of the
KM phase detection algorithm. We can only reassess this in April
The example below shows data collected over the identical piece of
absolutely featureless seafloor, as seen by the simultaneously (but
unsynchronized) operation of the EM2040C (left) and EM712 (right).
Vessel steaming from right to left. Note that the 2040C, operating
in dual swath mode, had been pulled into +/-60 deg, whereas the 712
was operating at +/-65 deg (in single swath mode).
EM2040C
|
EM712
|
|
|
|
|
whole swath showing prevalence of
the artifact on port side.
|

|

|
zoom in on port outer swath to
show mistracking details.
|
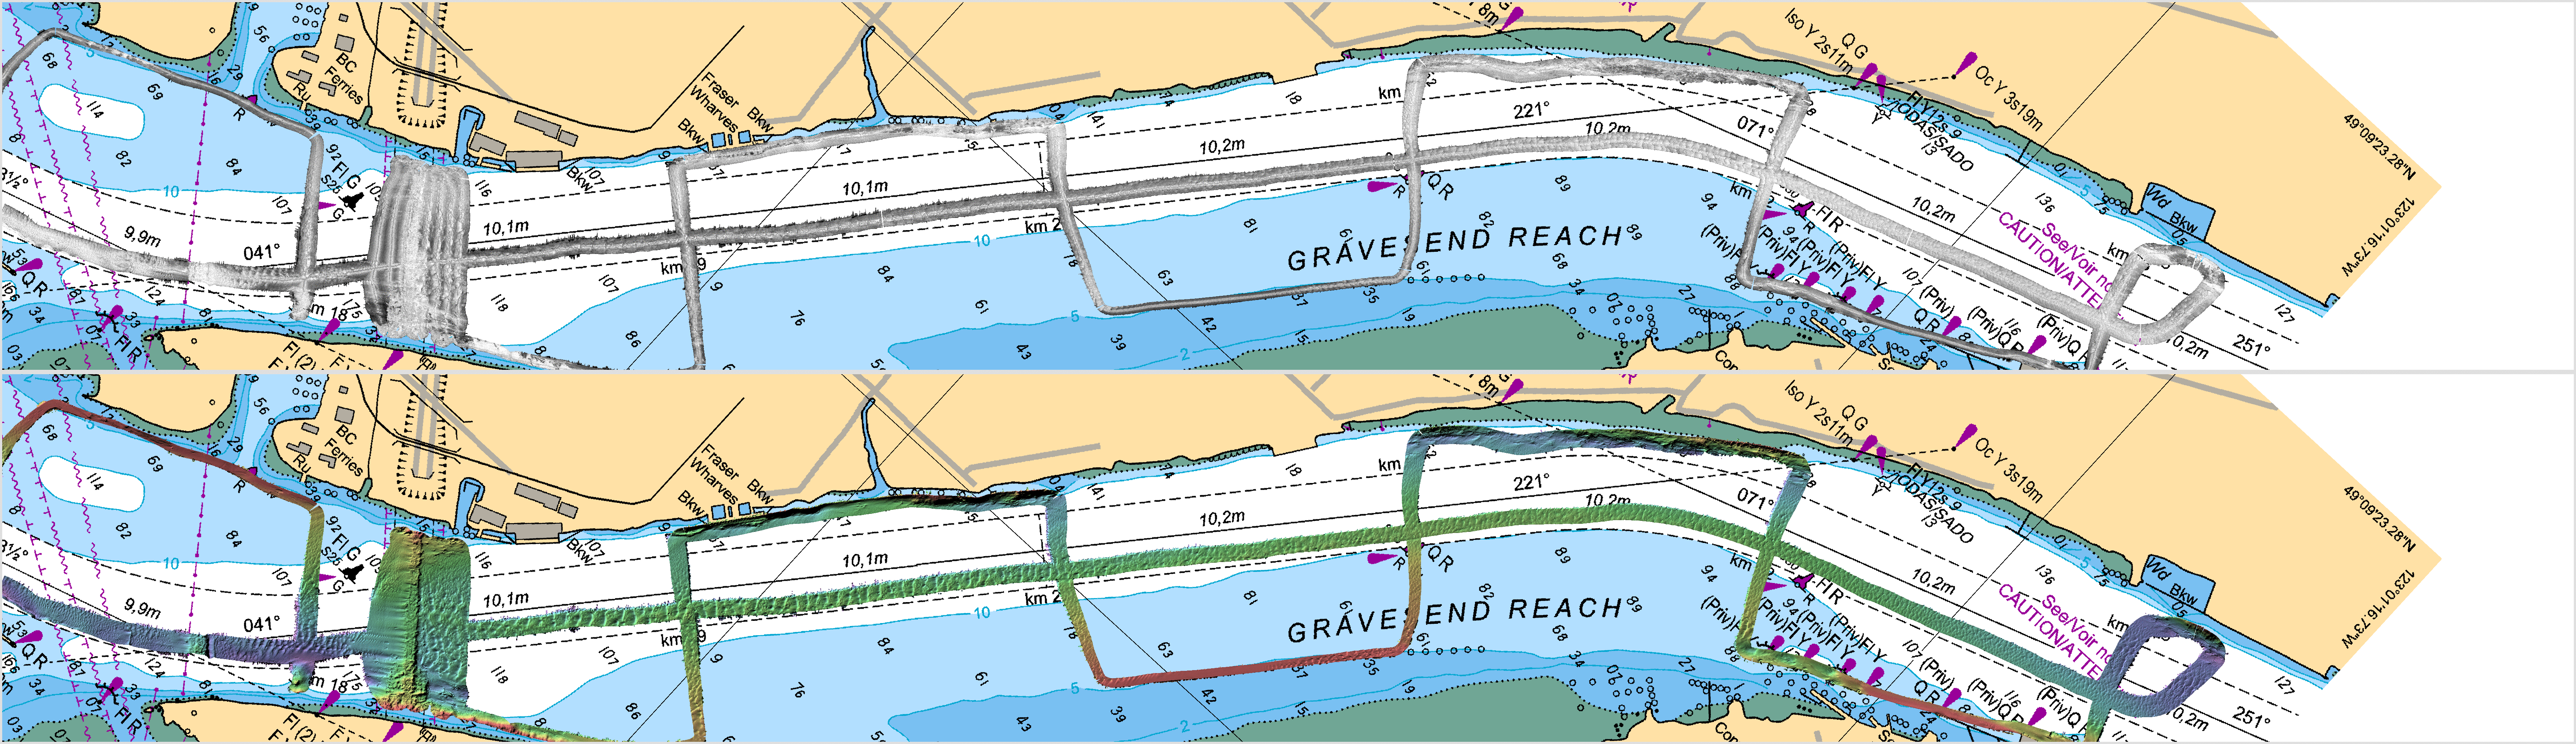
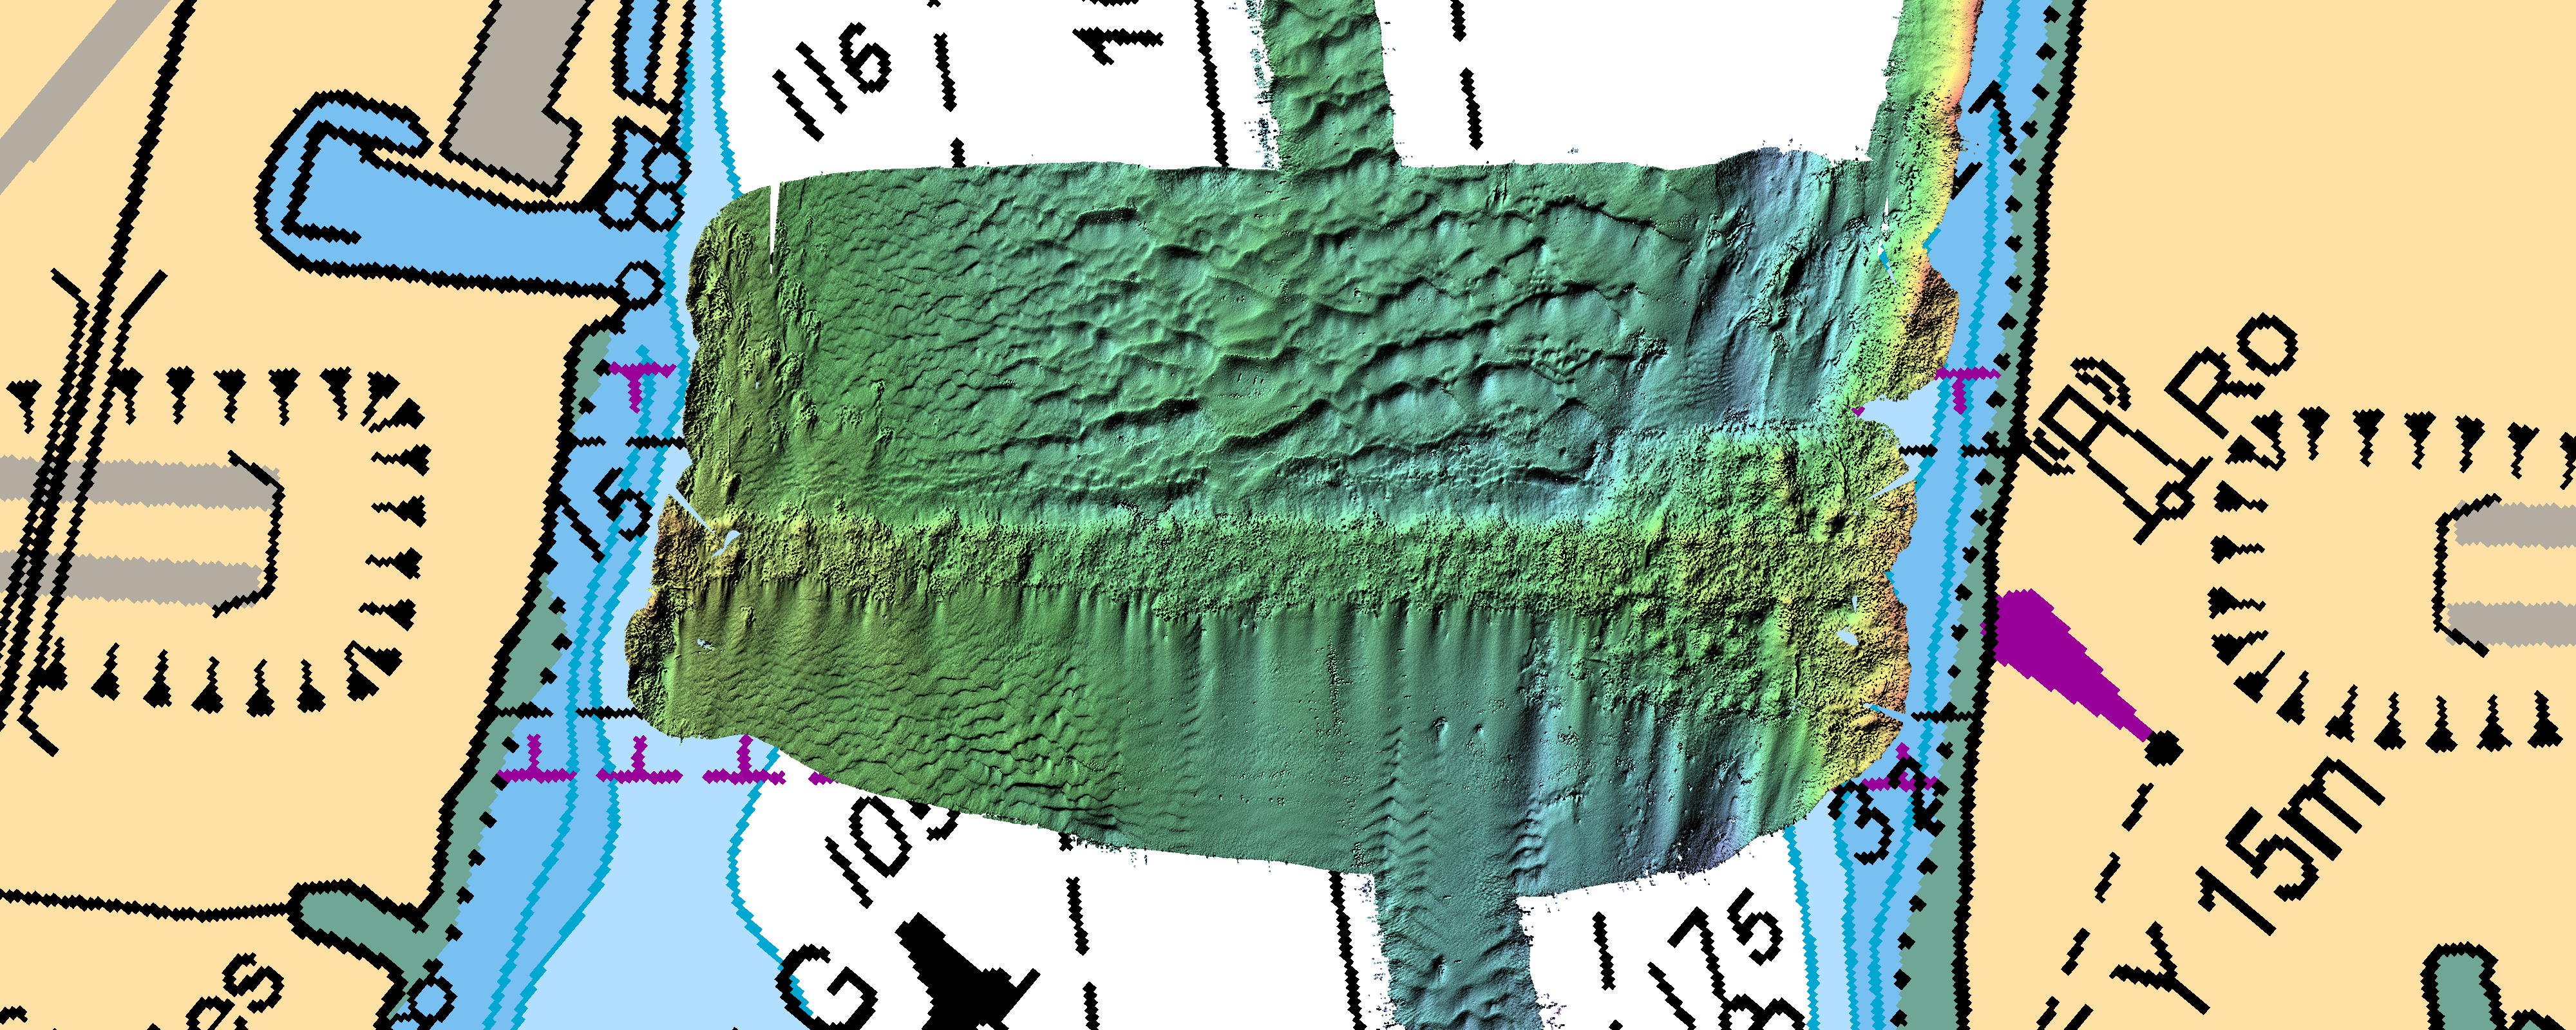
George Massey Tunnel
Along the Gravesend Reach, the George Massey Tunnel passes under the
river. It is actually a series of concrete caissons sunk into the
river bed covered in rip-rap and it protrudes slightly. The images
below illustrate the seabed expression and the impact it has on the
sediment transport upstream and downstream of the protrusion:
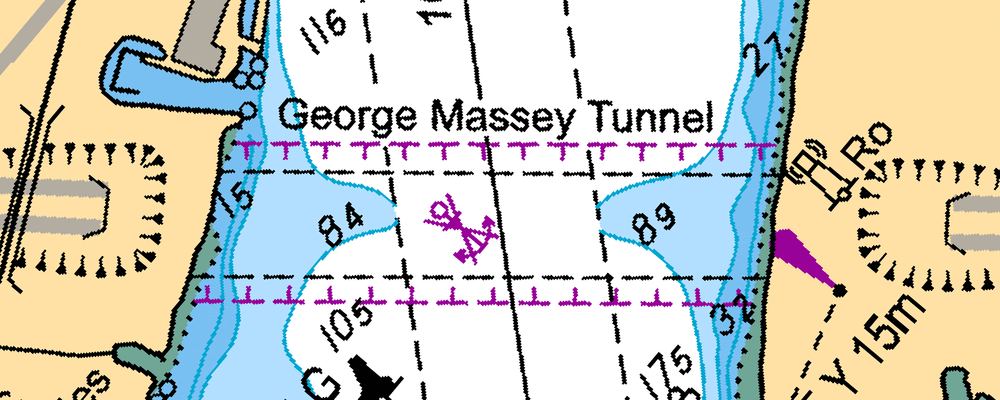
extract of CHS Chart 3490
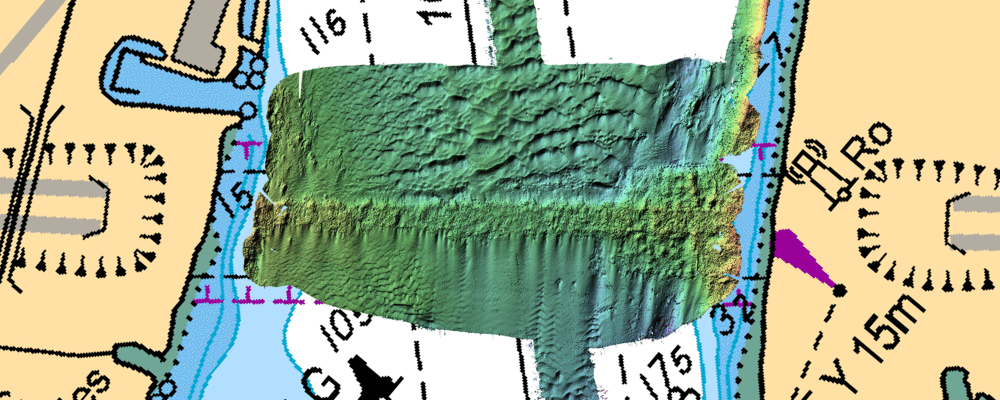
EM2040C bathymetry (unedited) - click for 0.25m grid
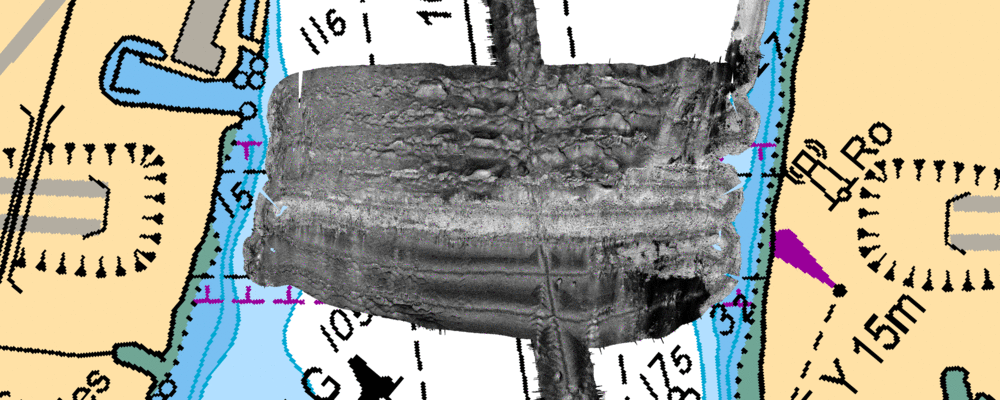
EM2040C backscatter (140-190 DN) - click for 0.25m mosaic
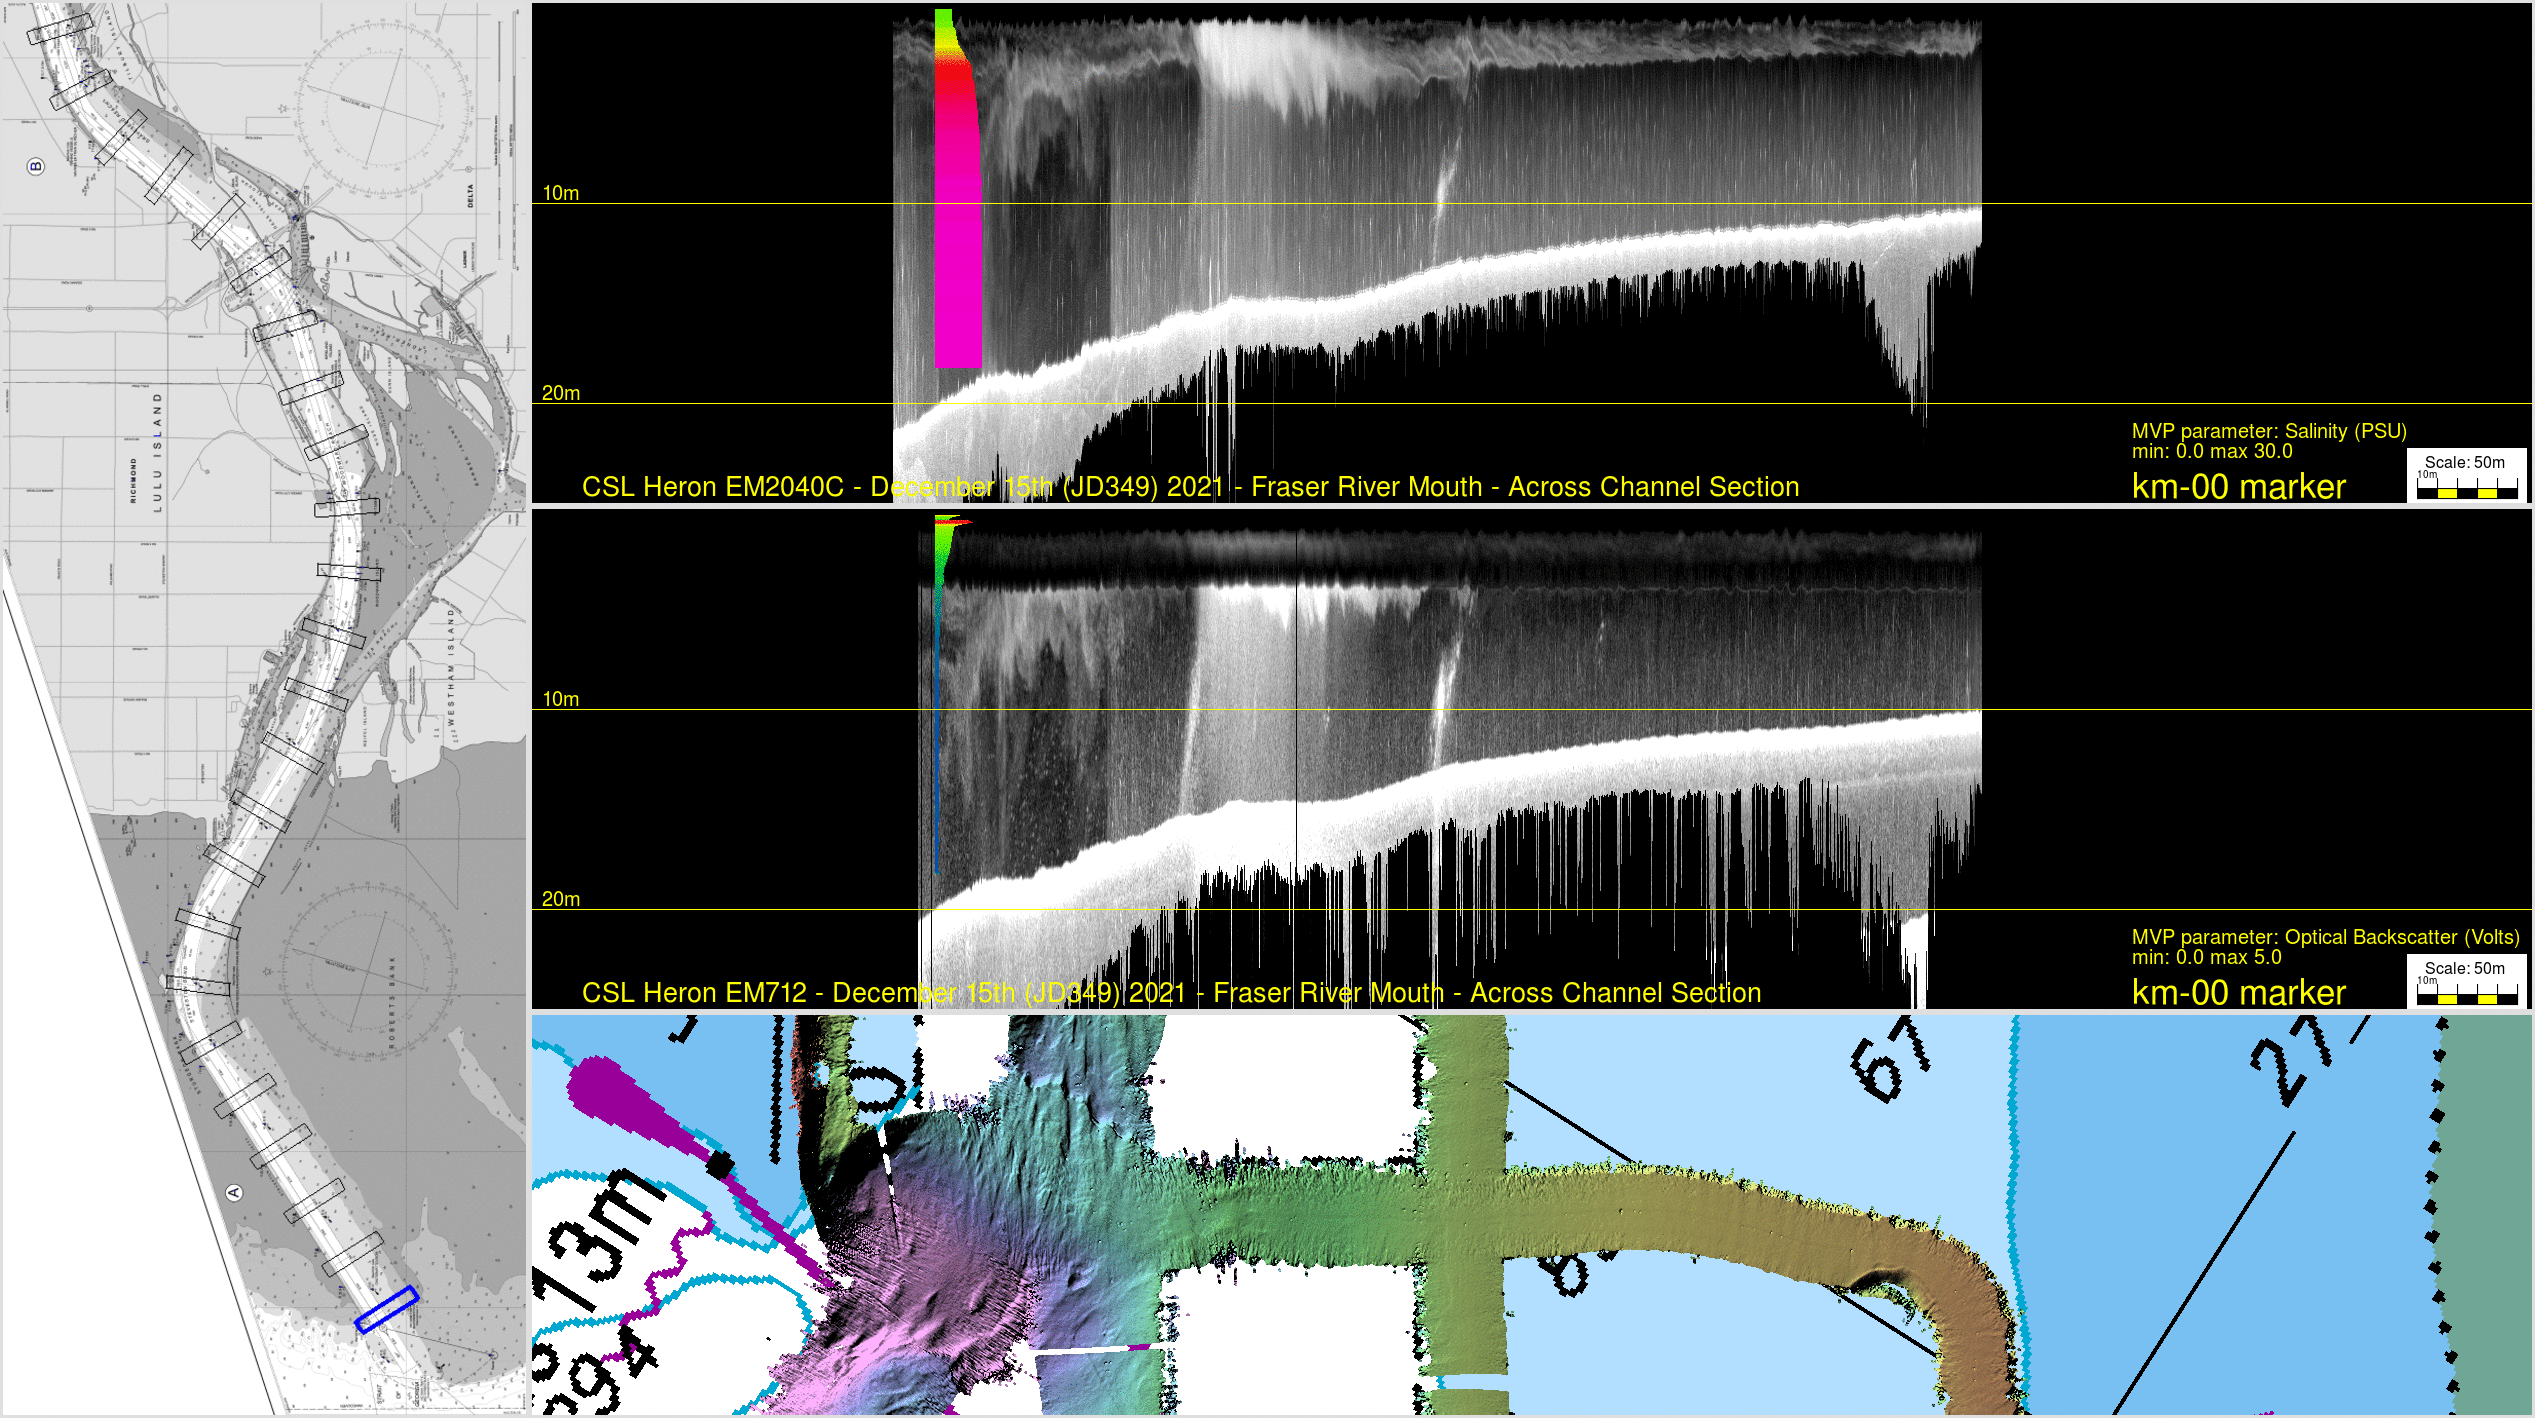
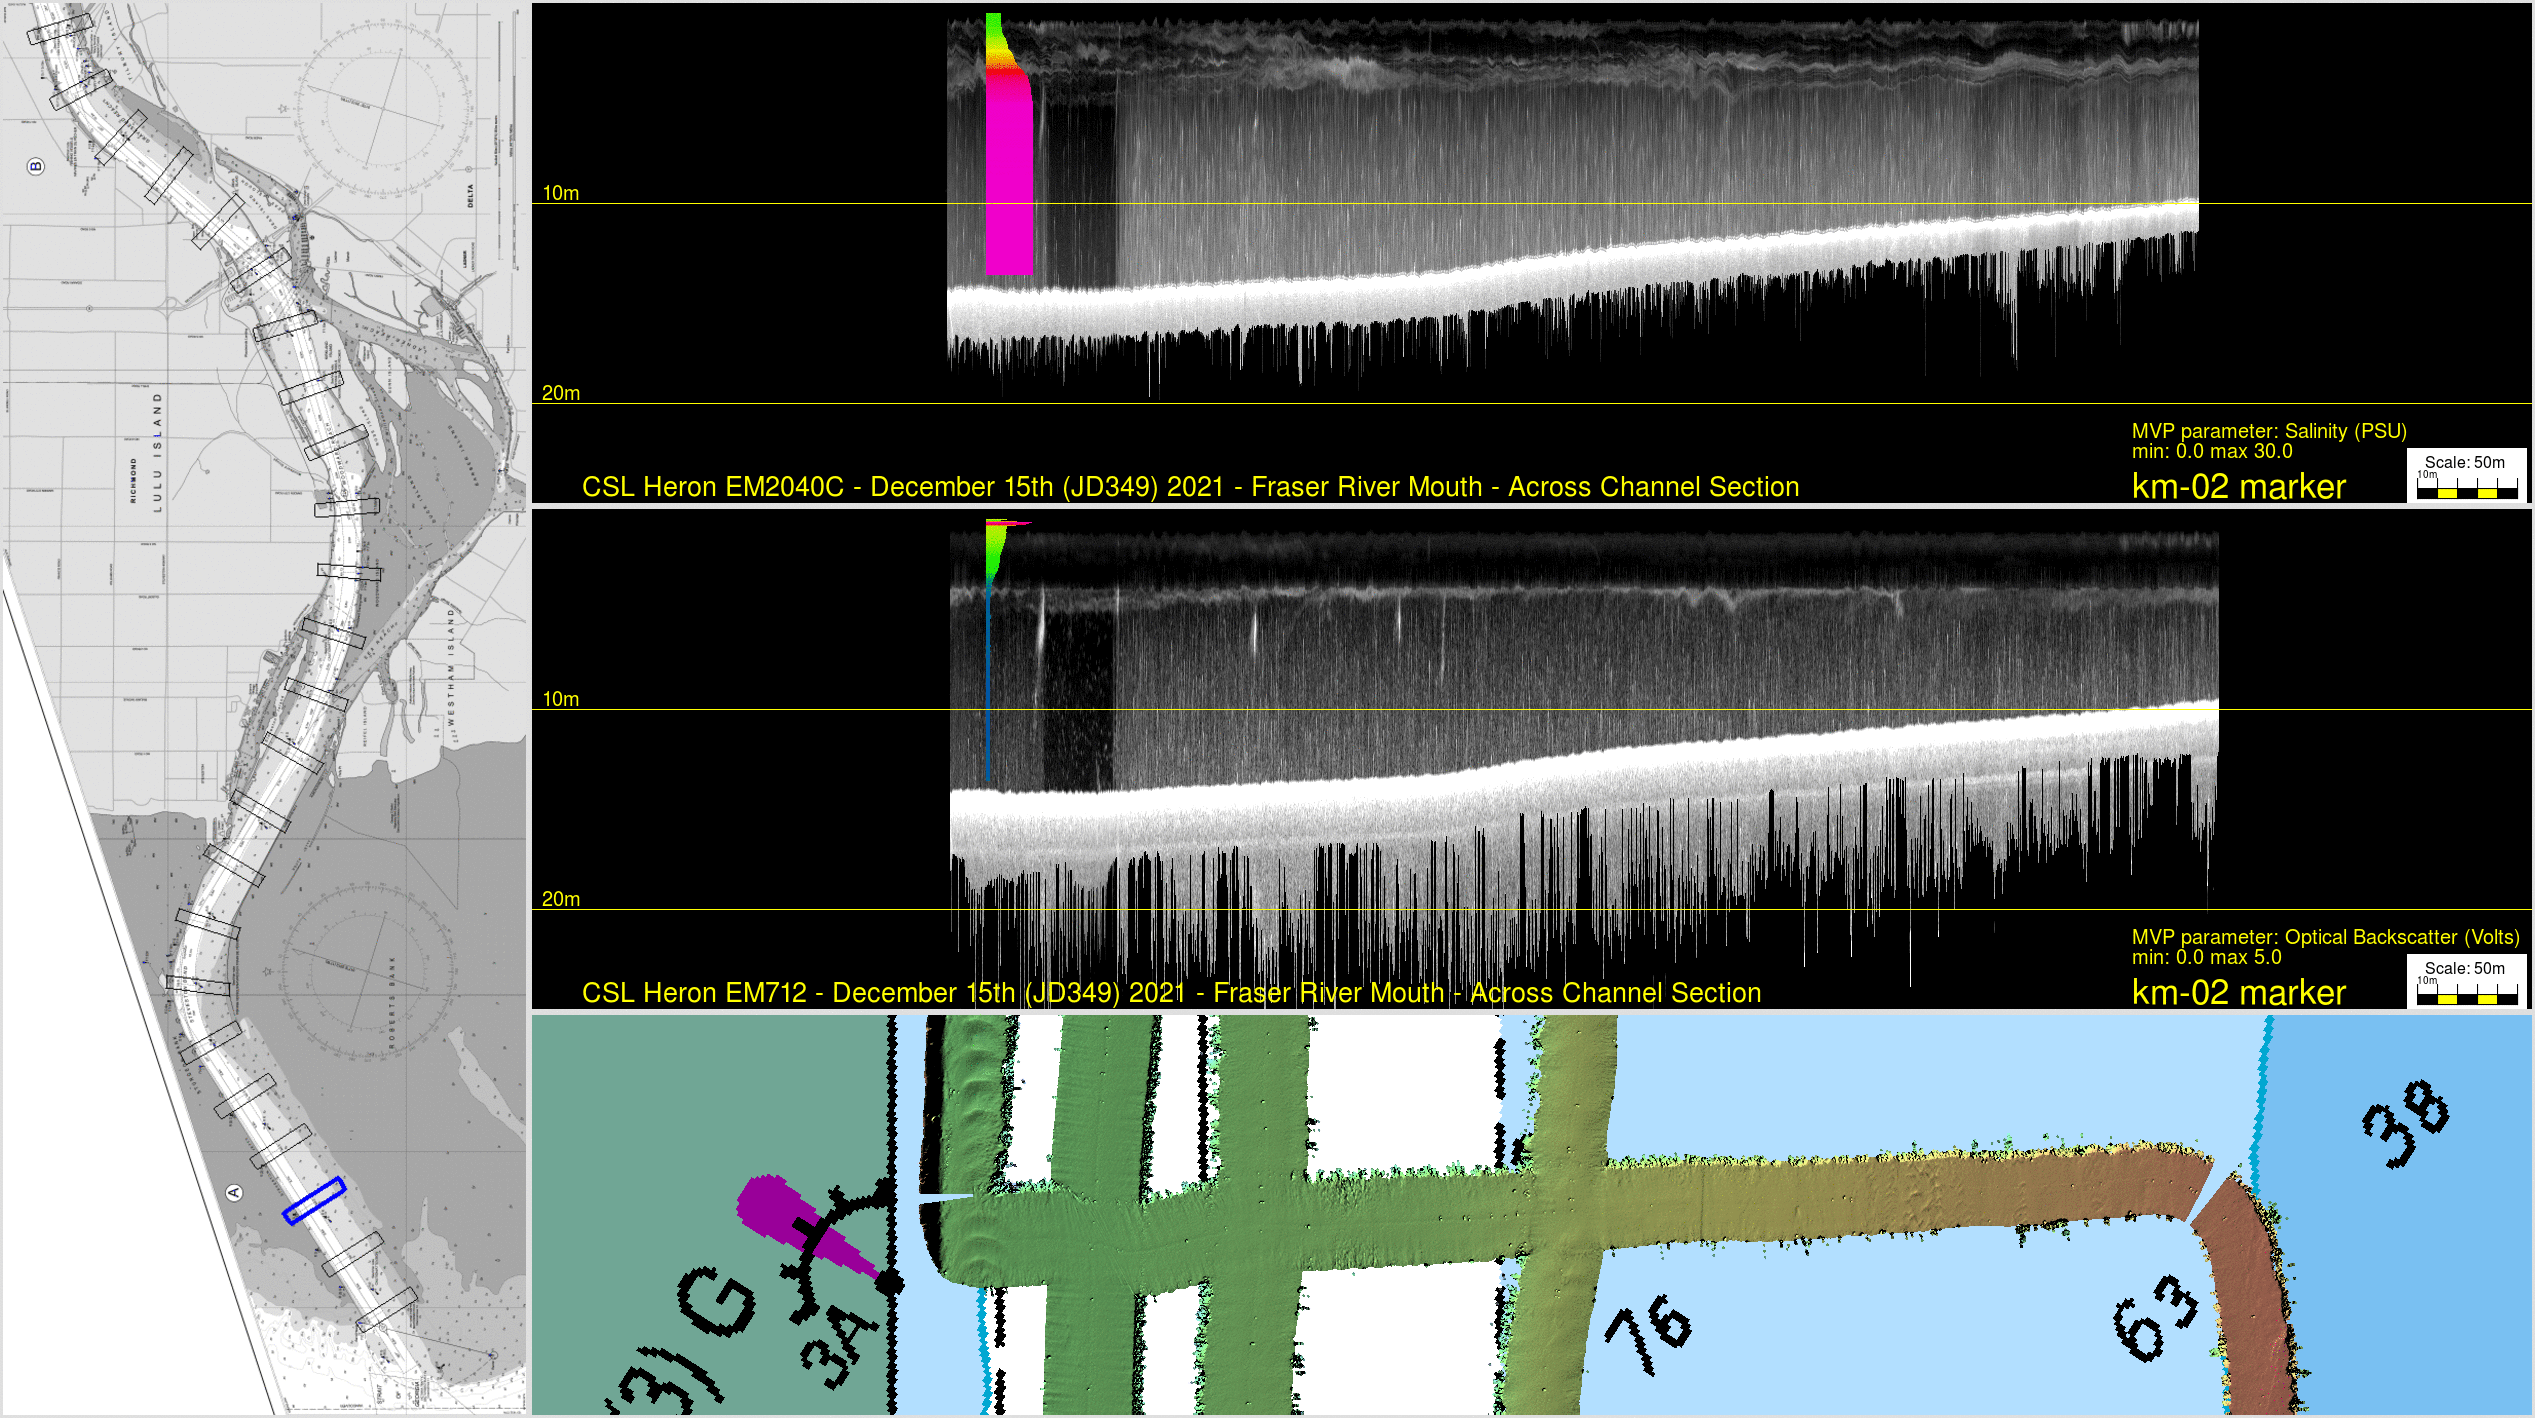
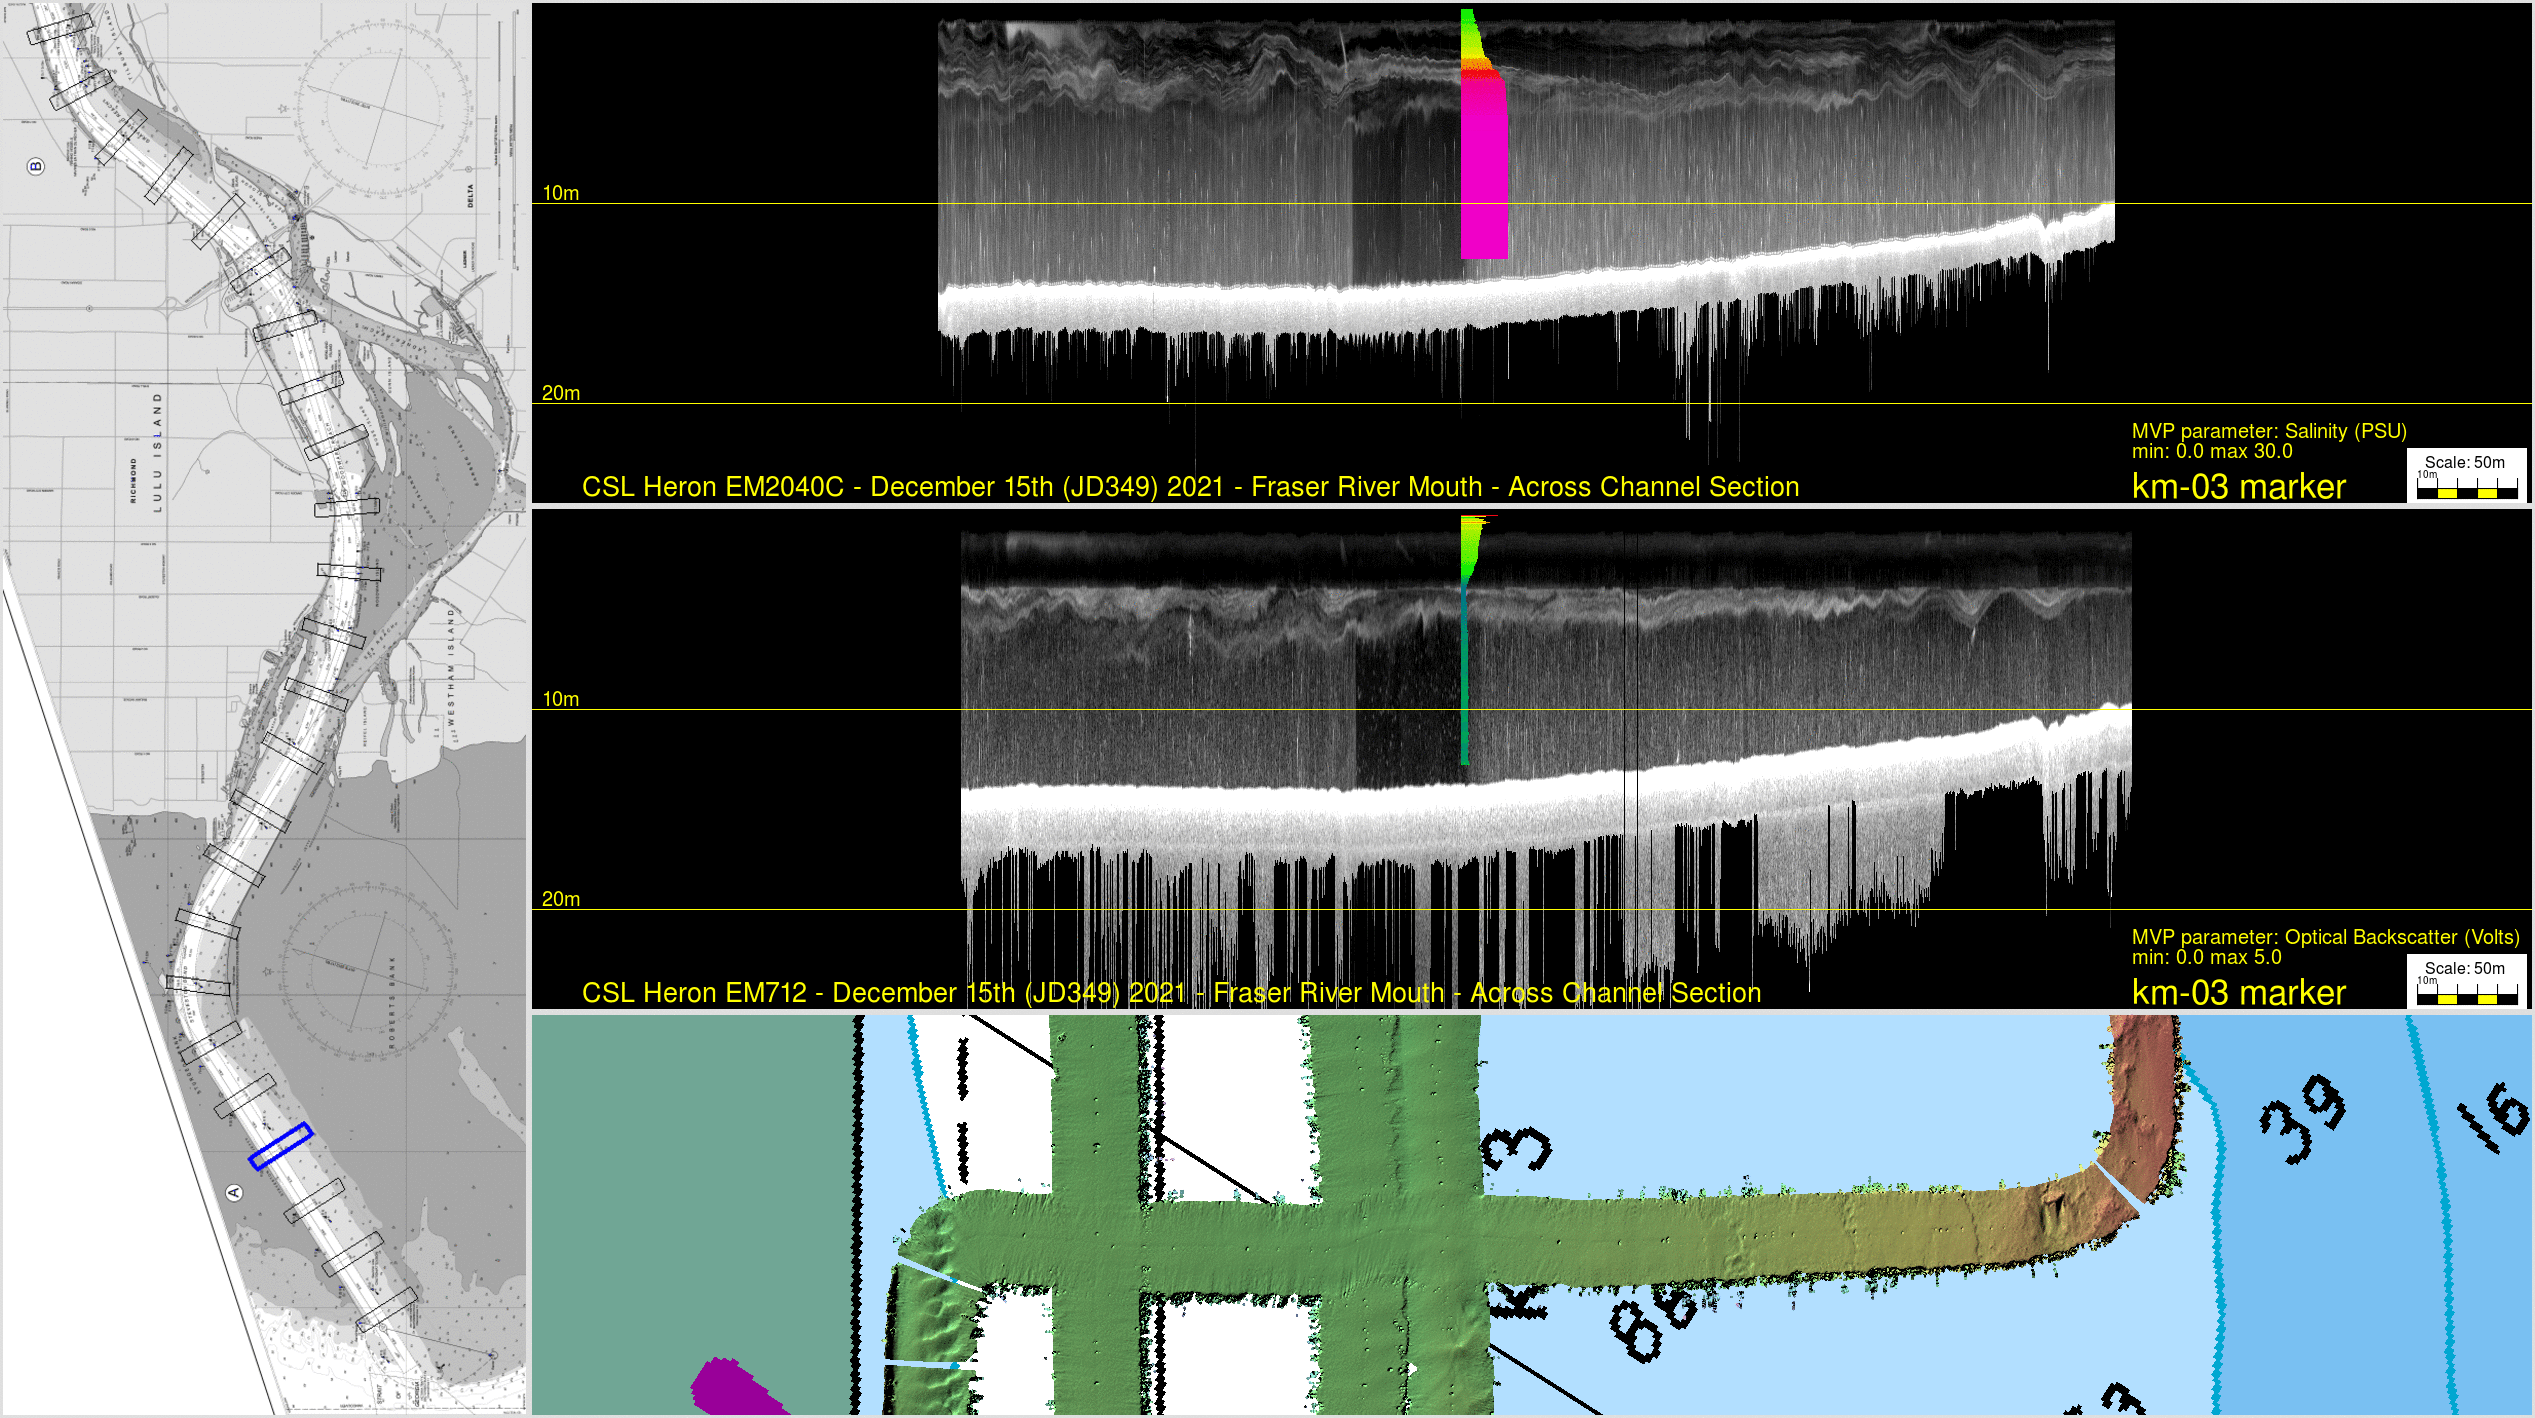
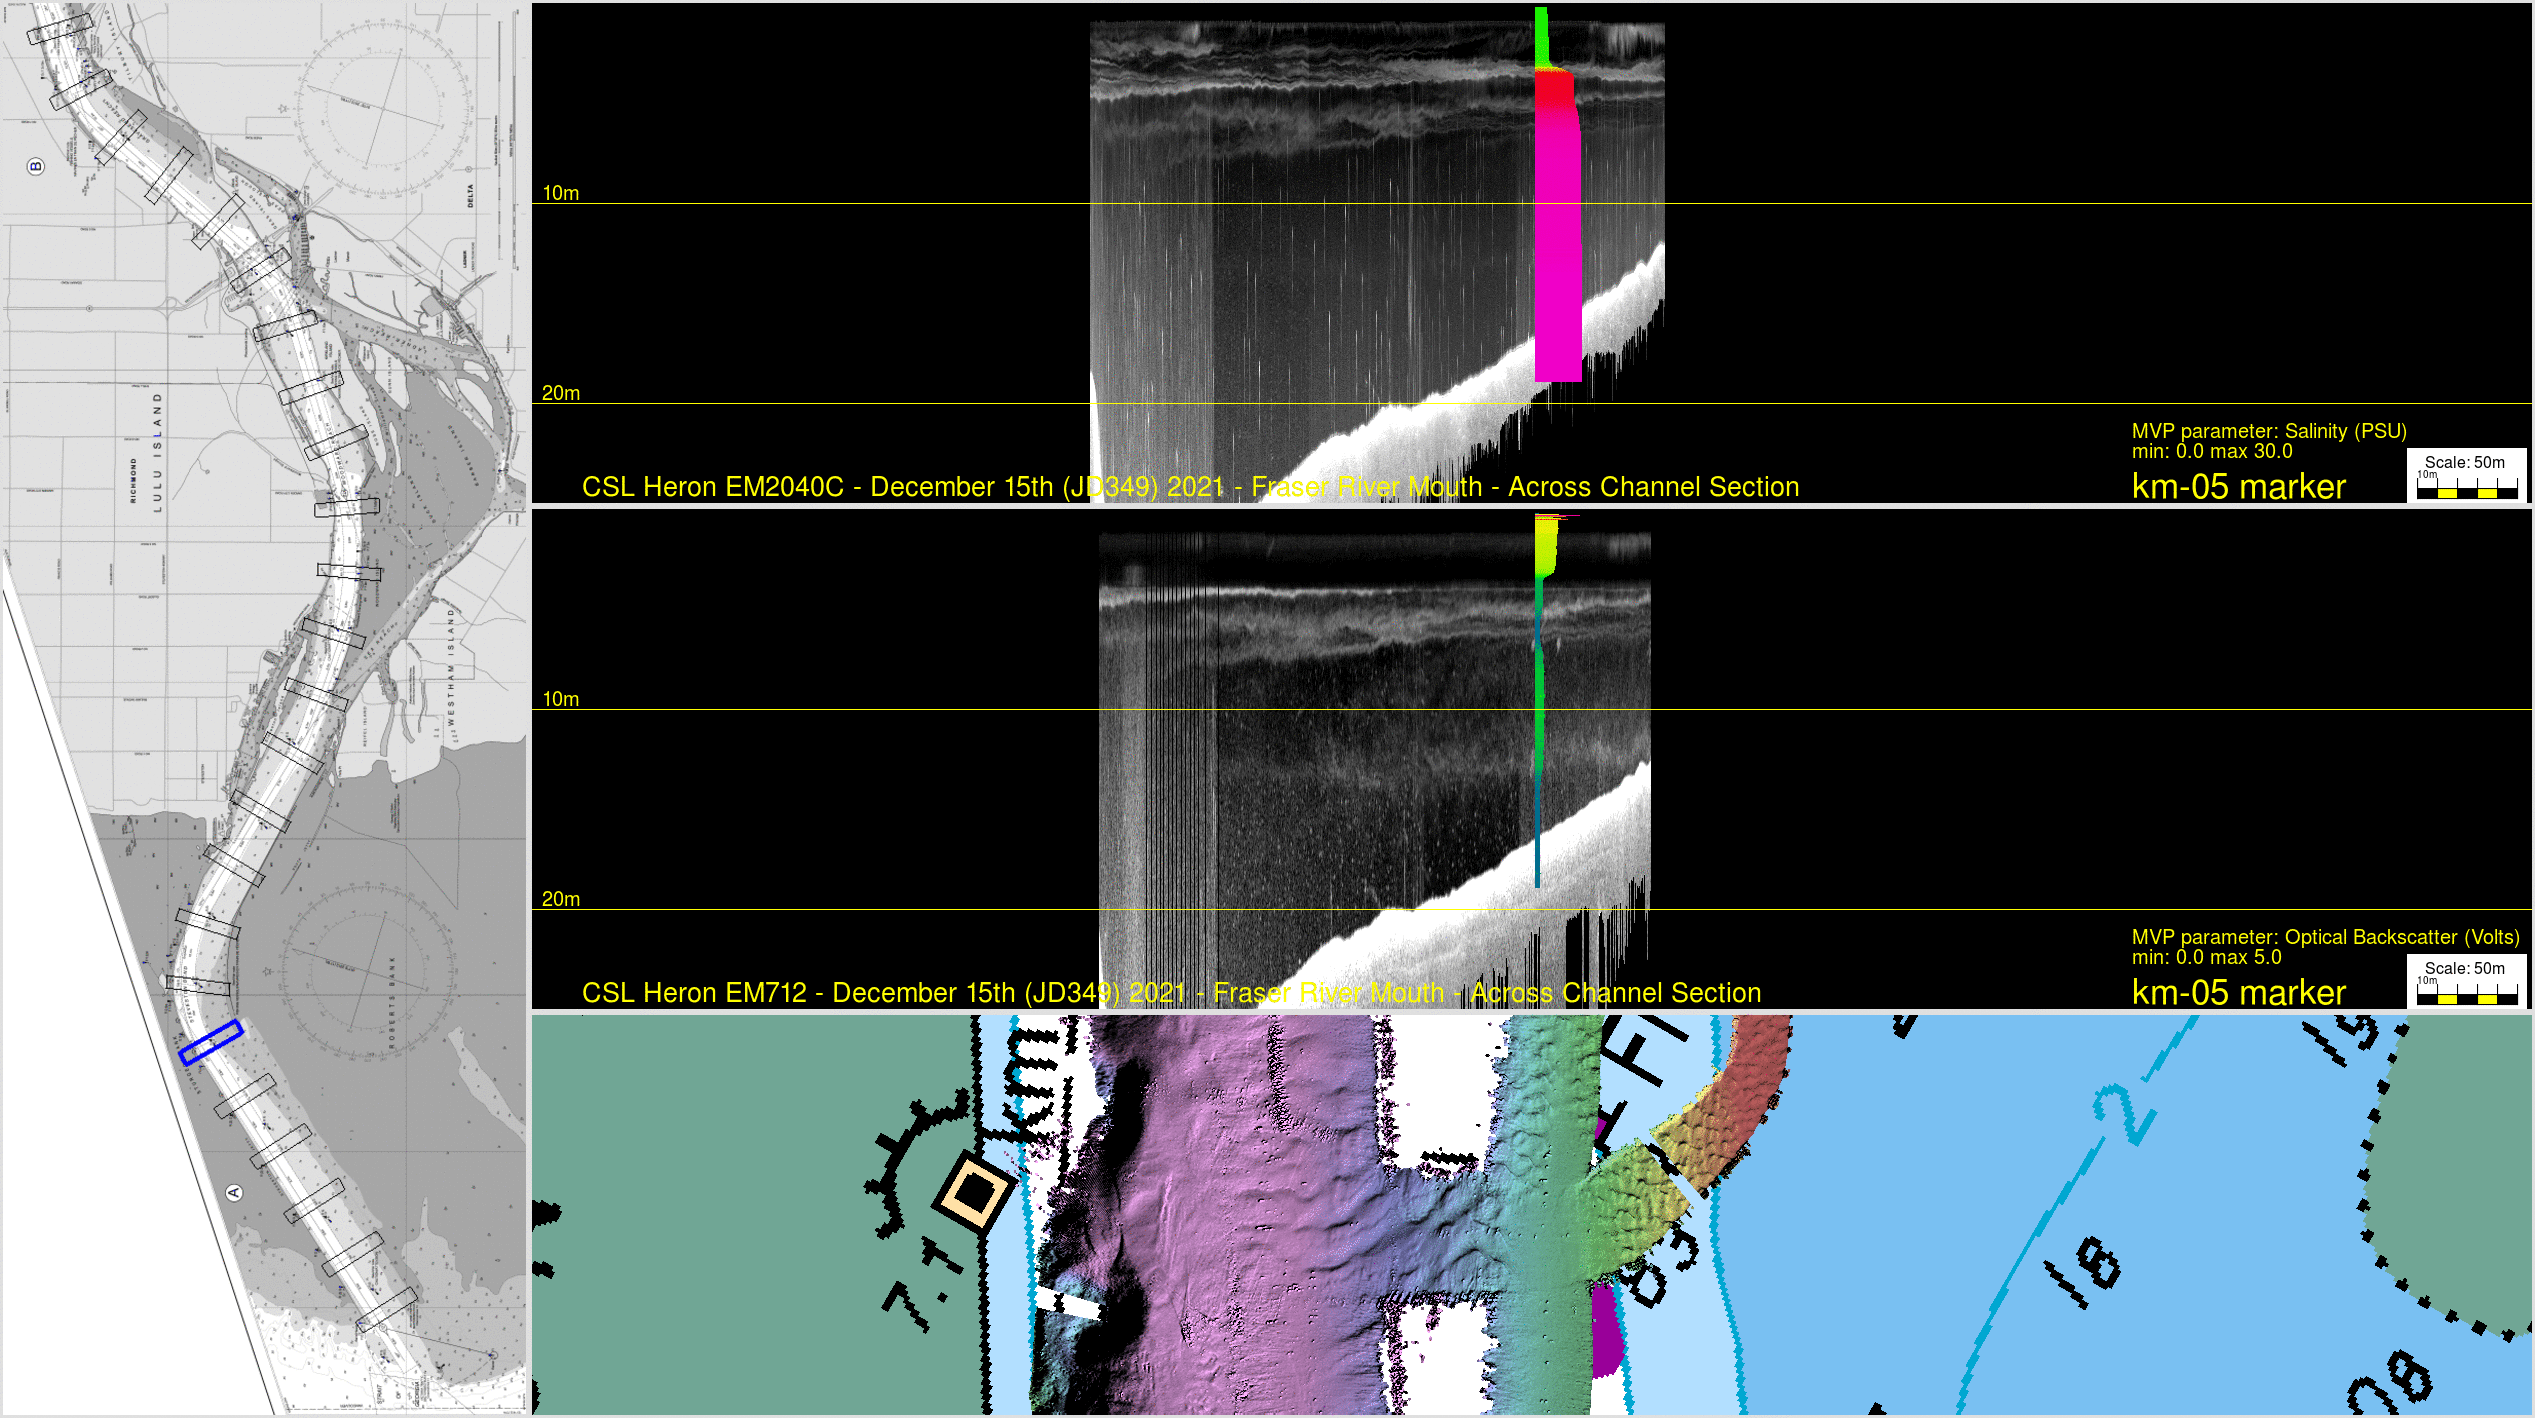
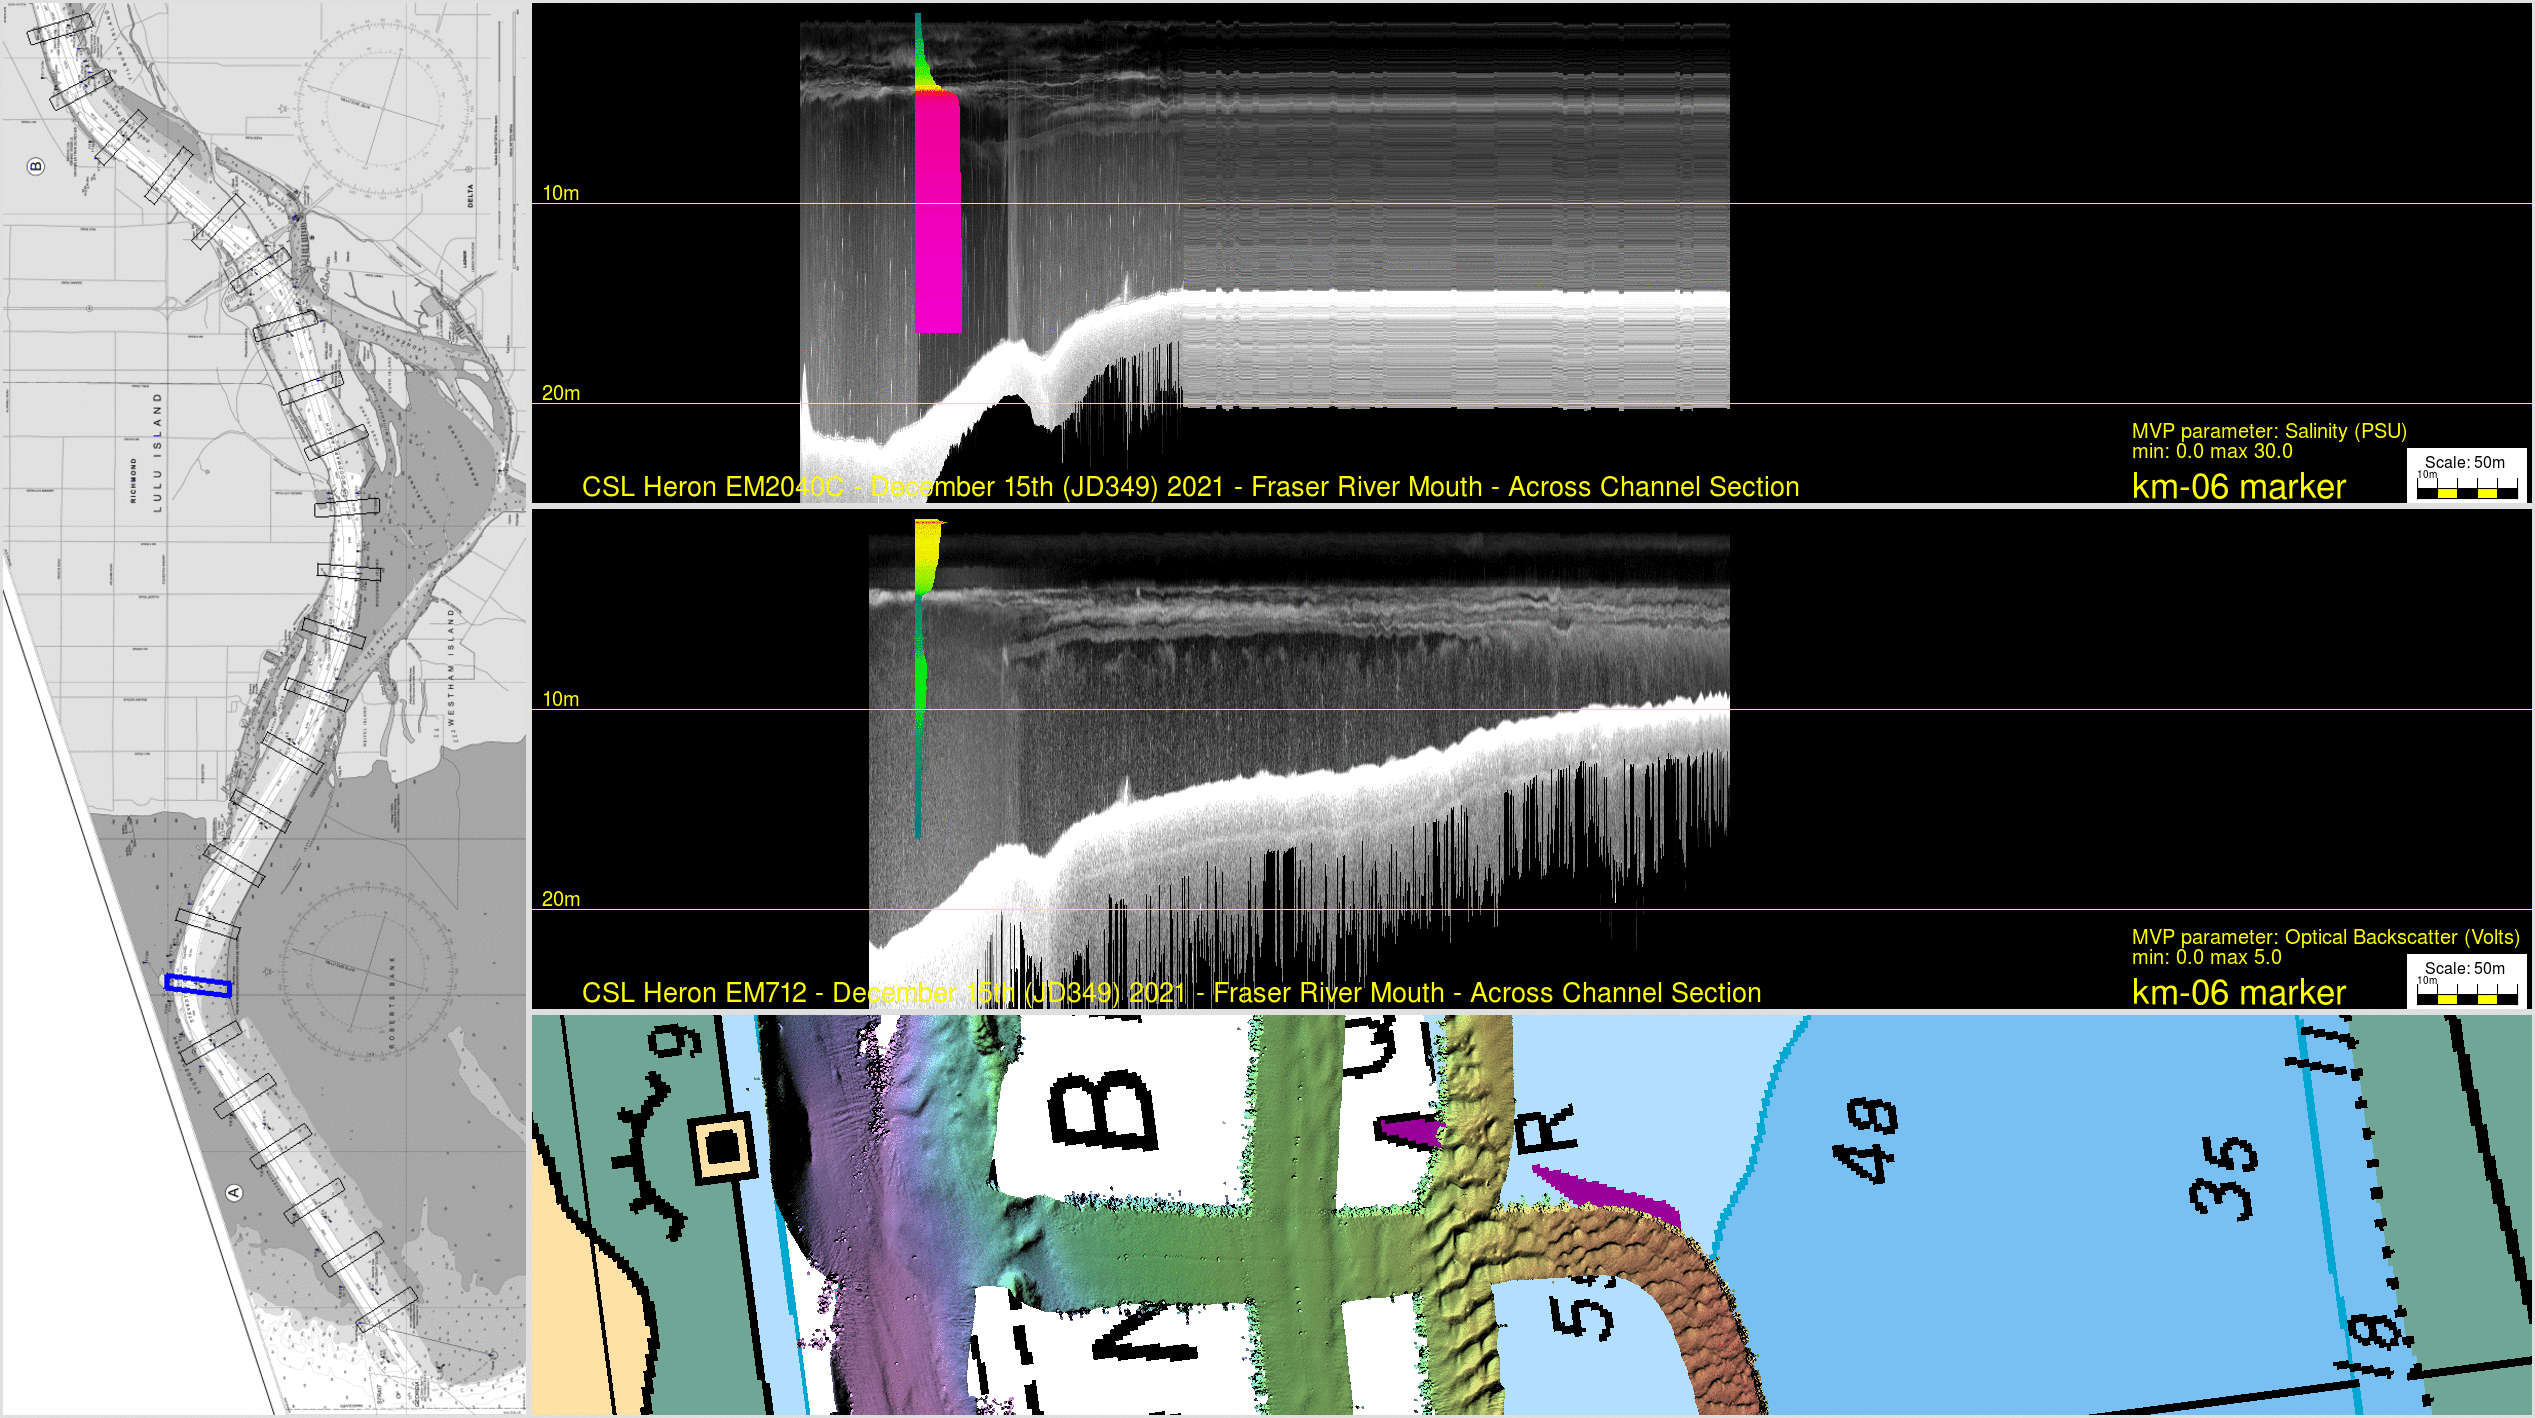
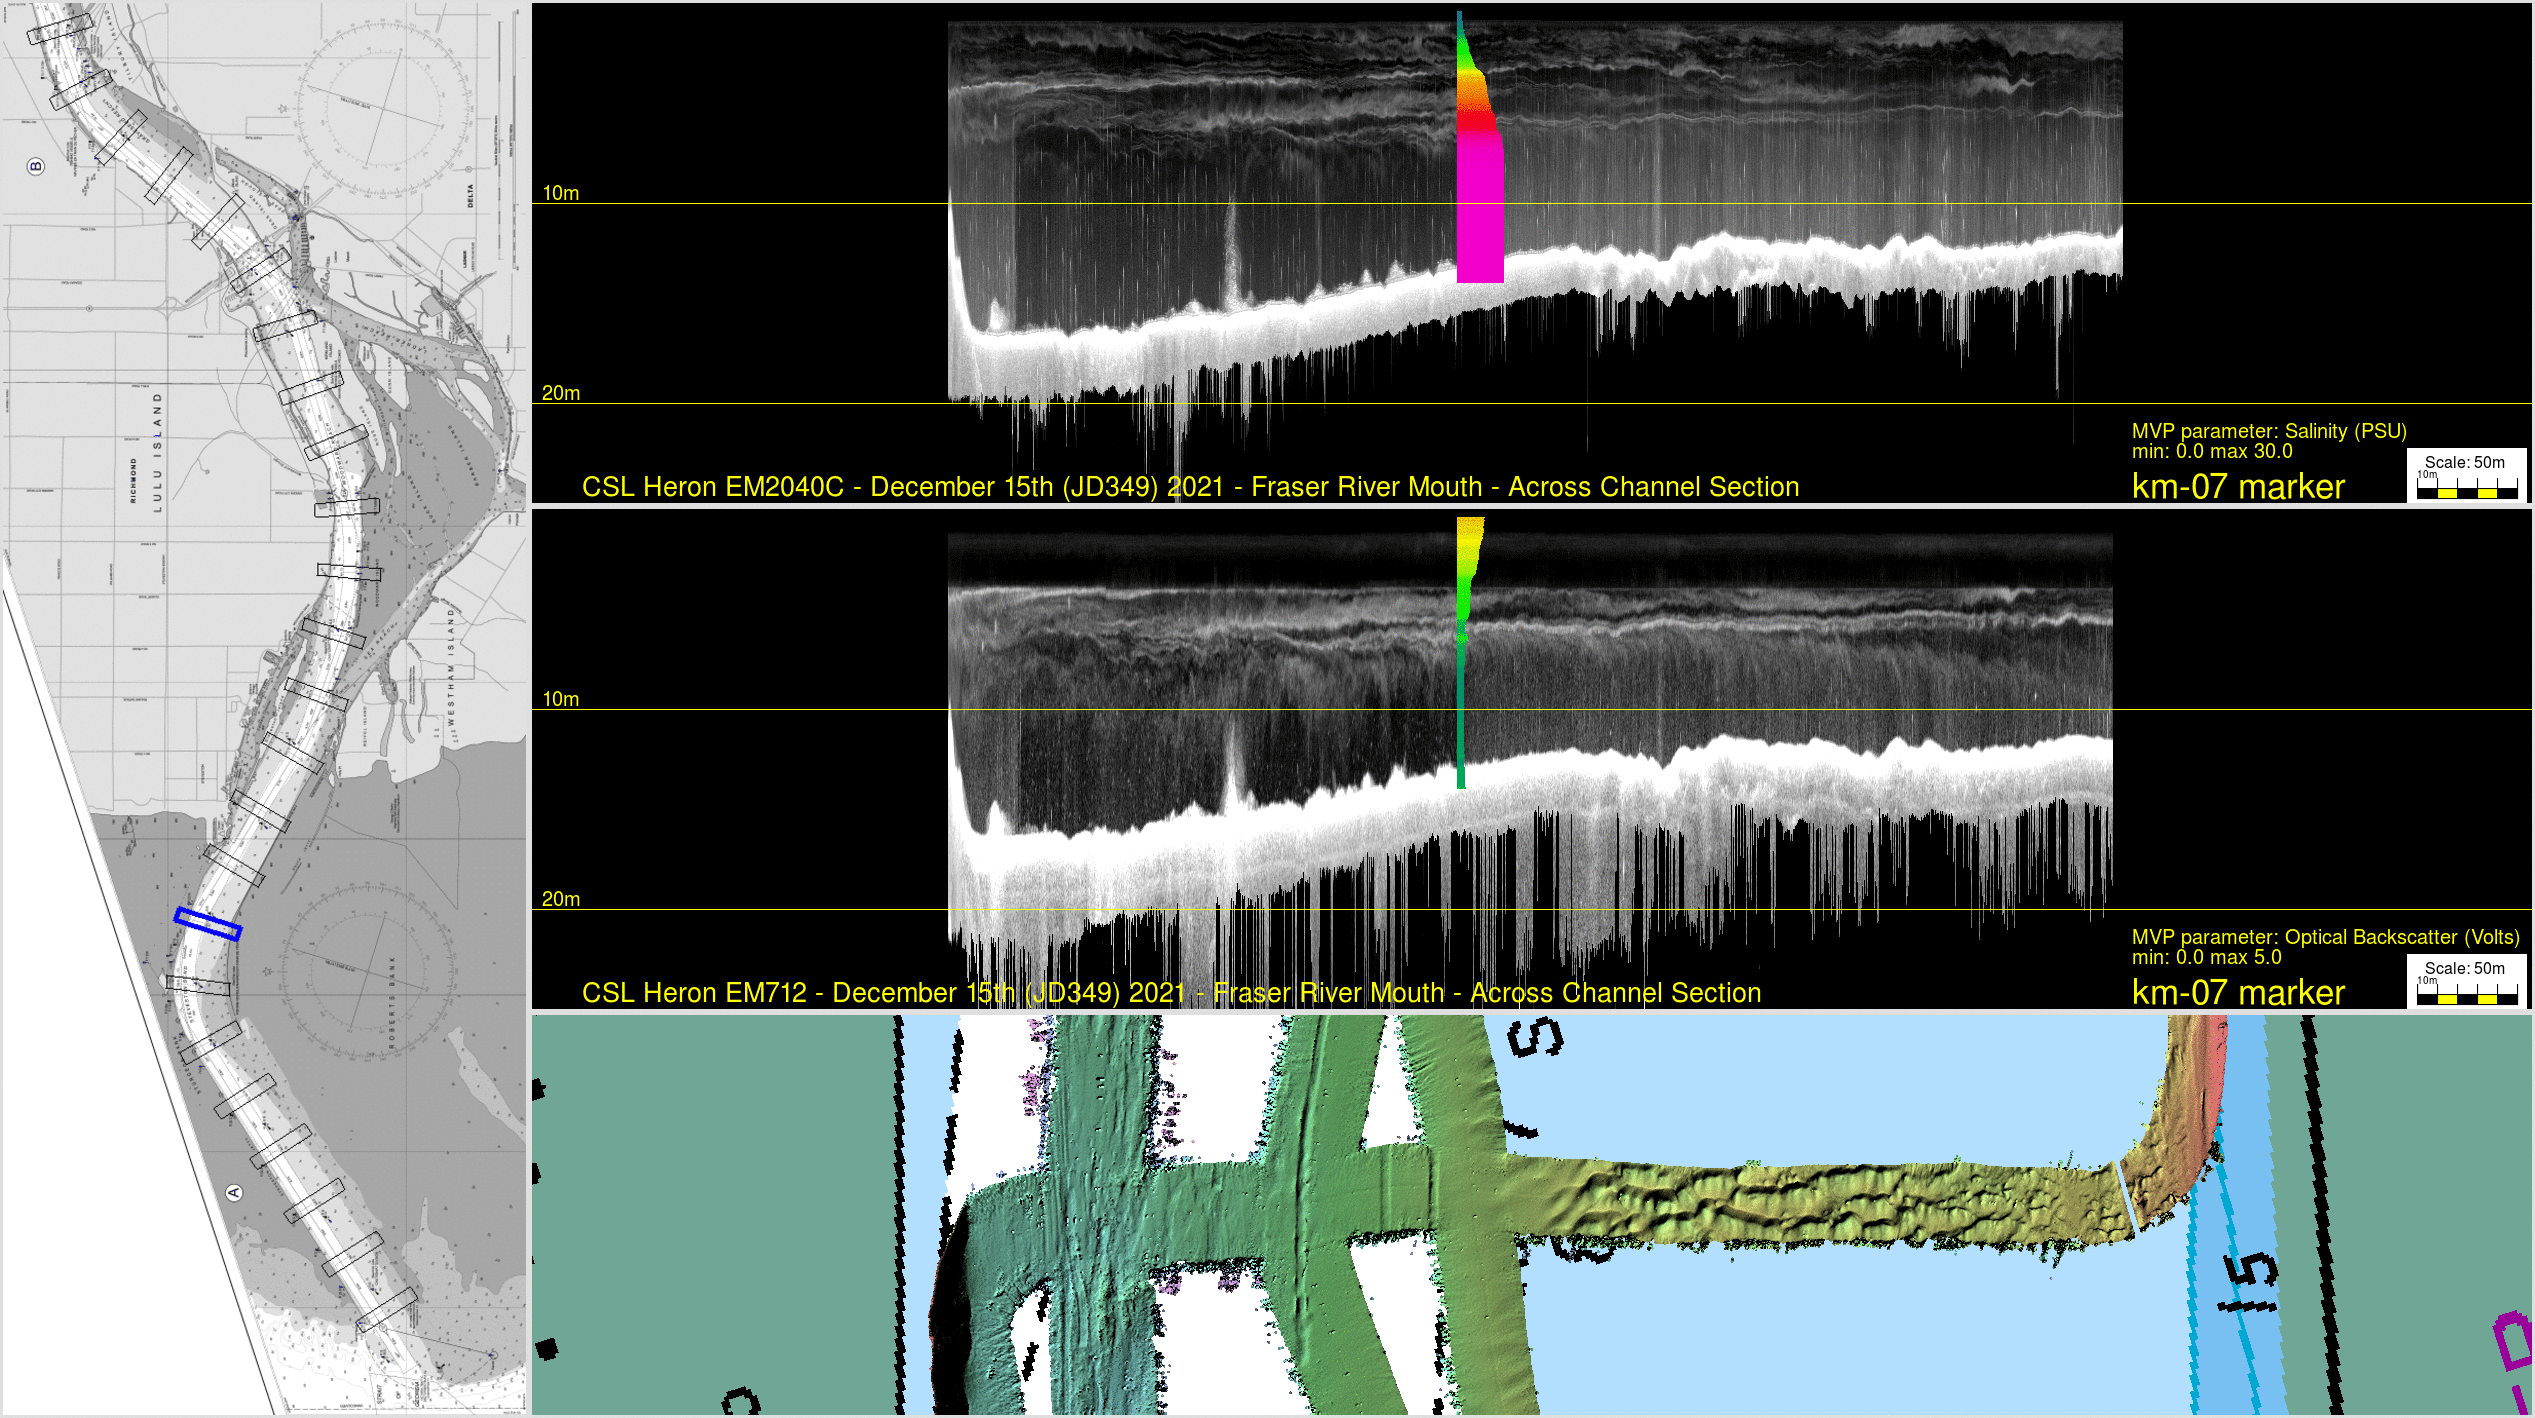
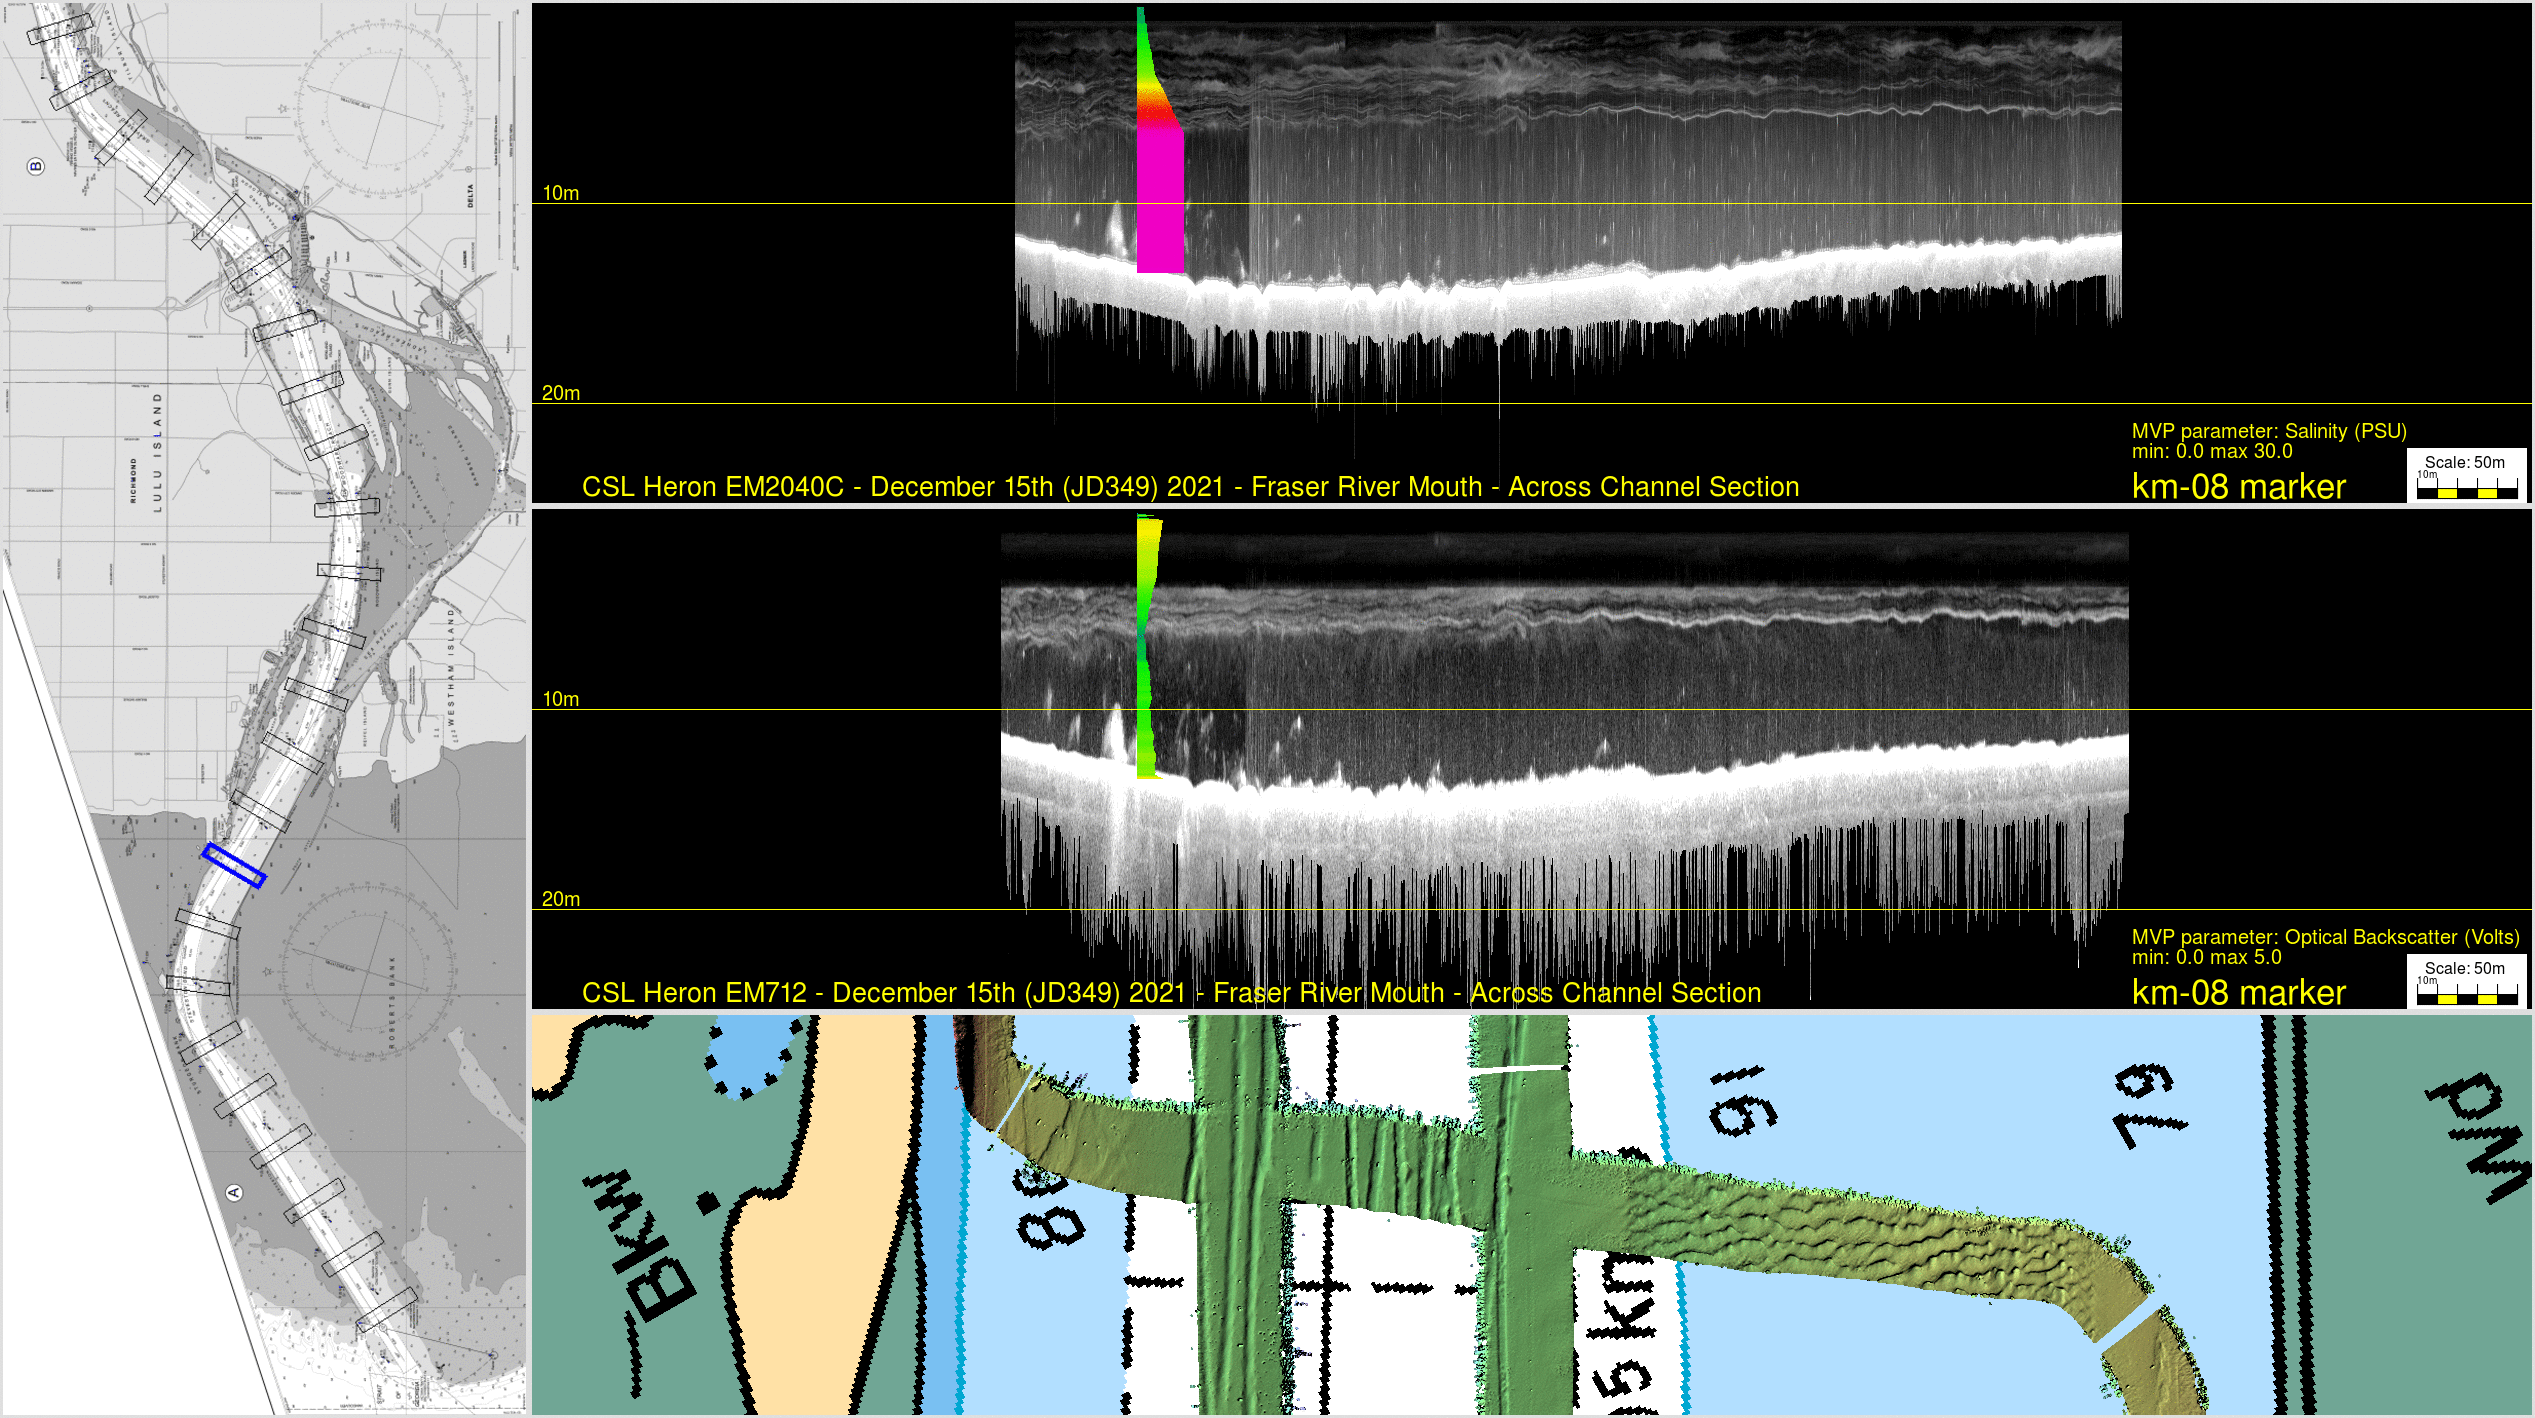
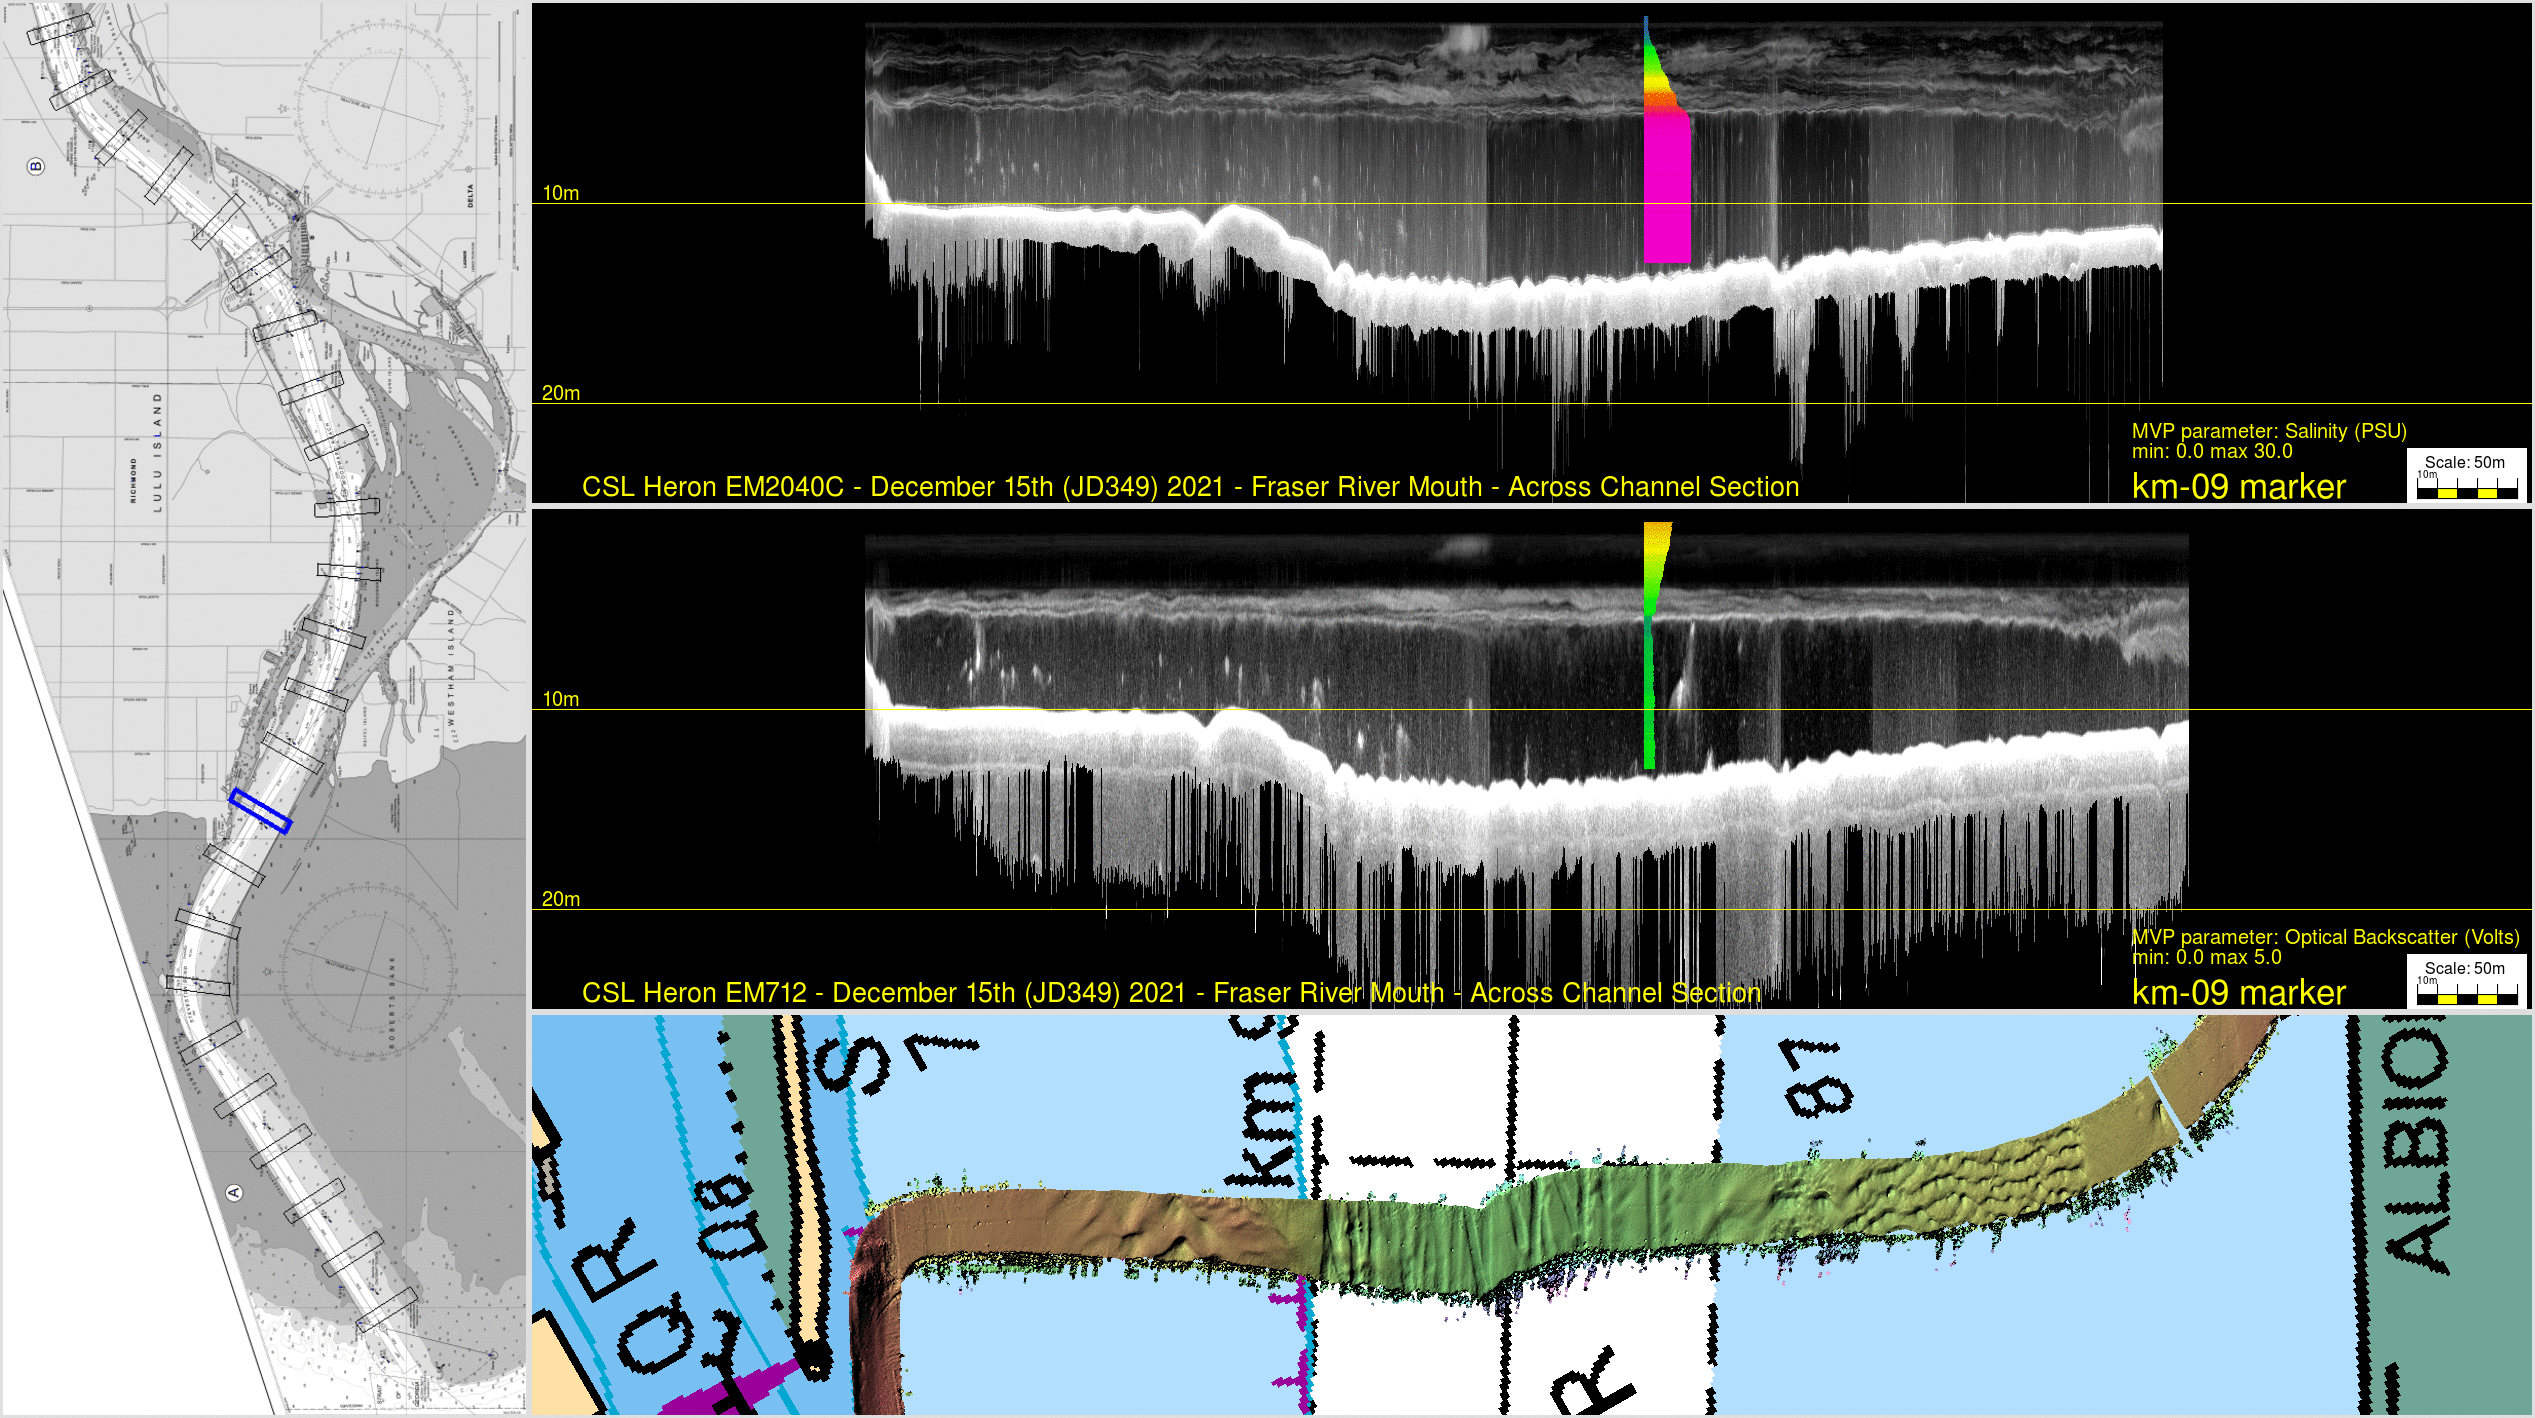
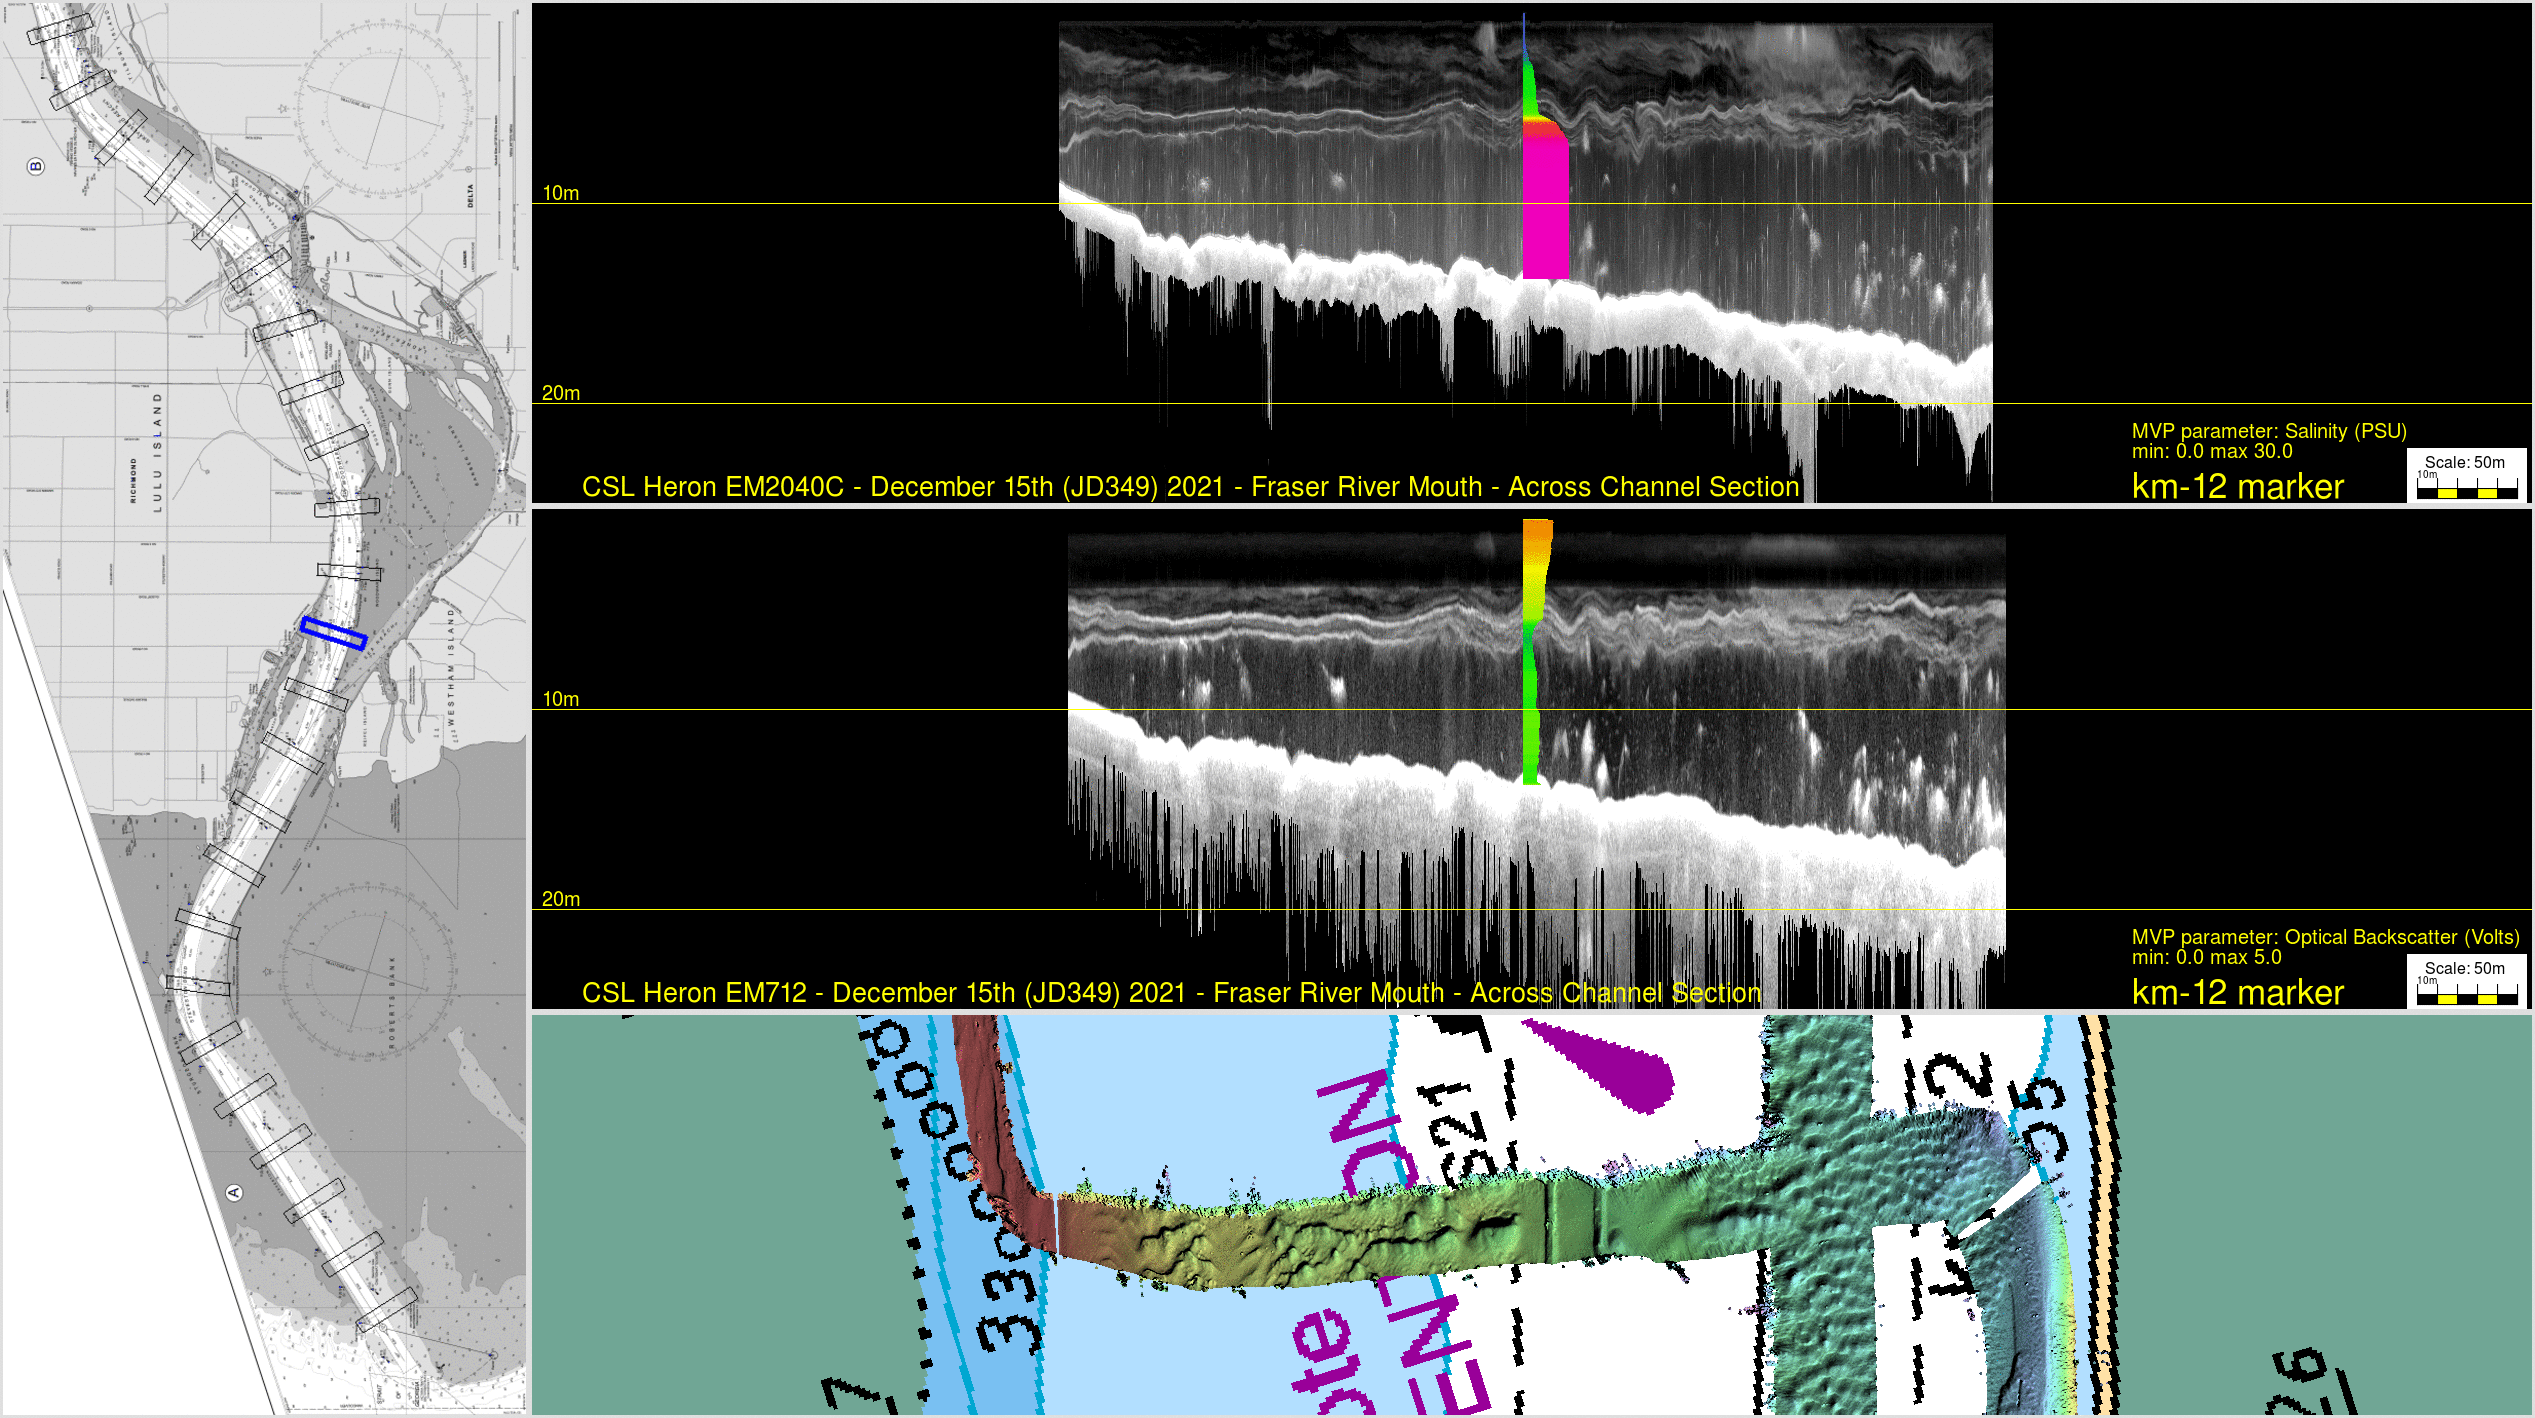
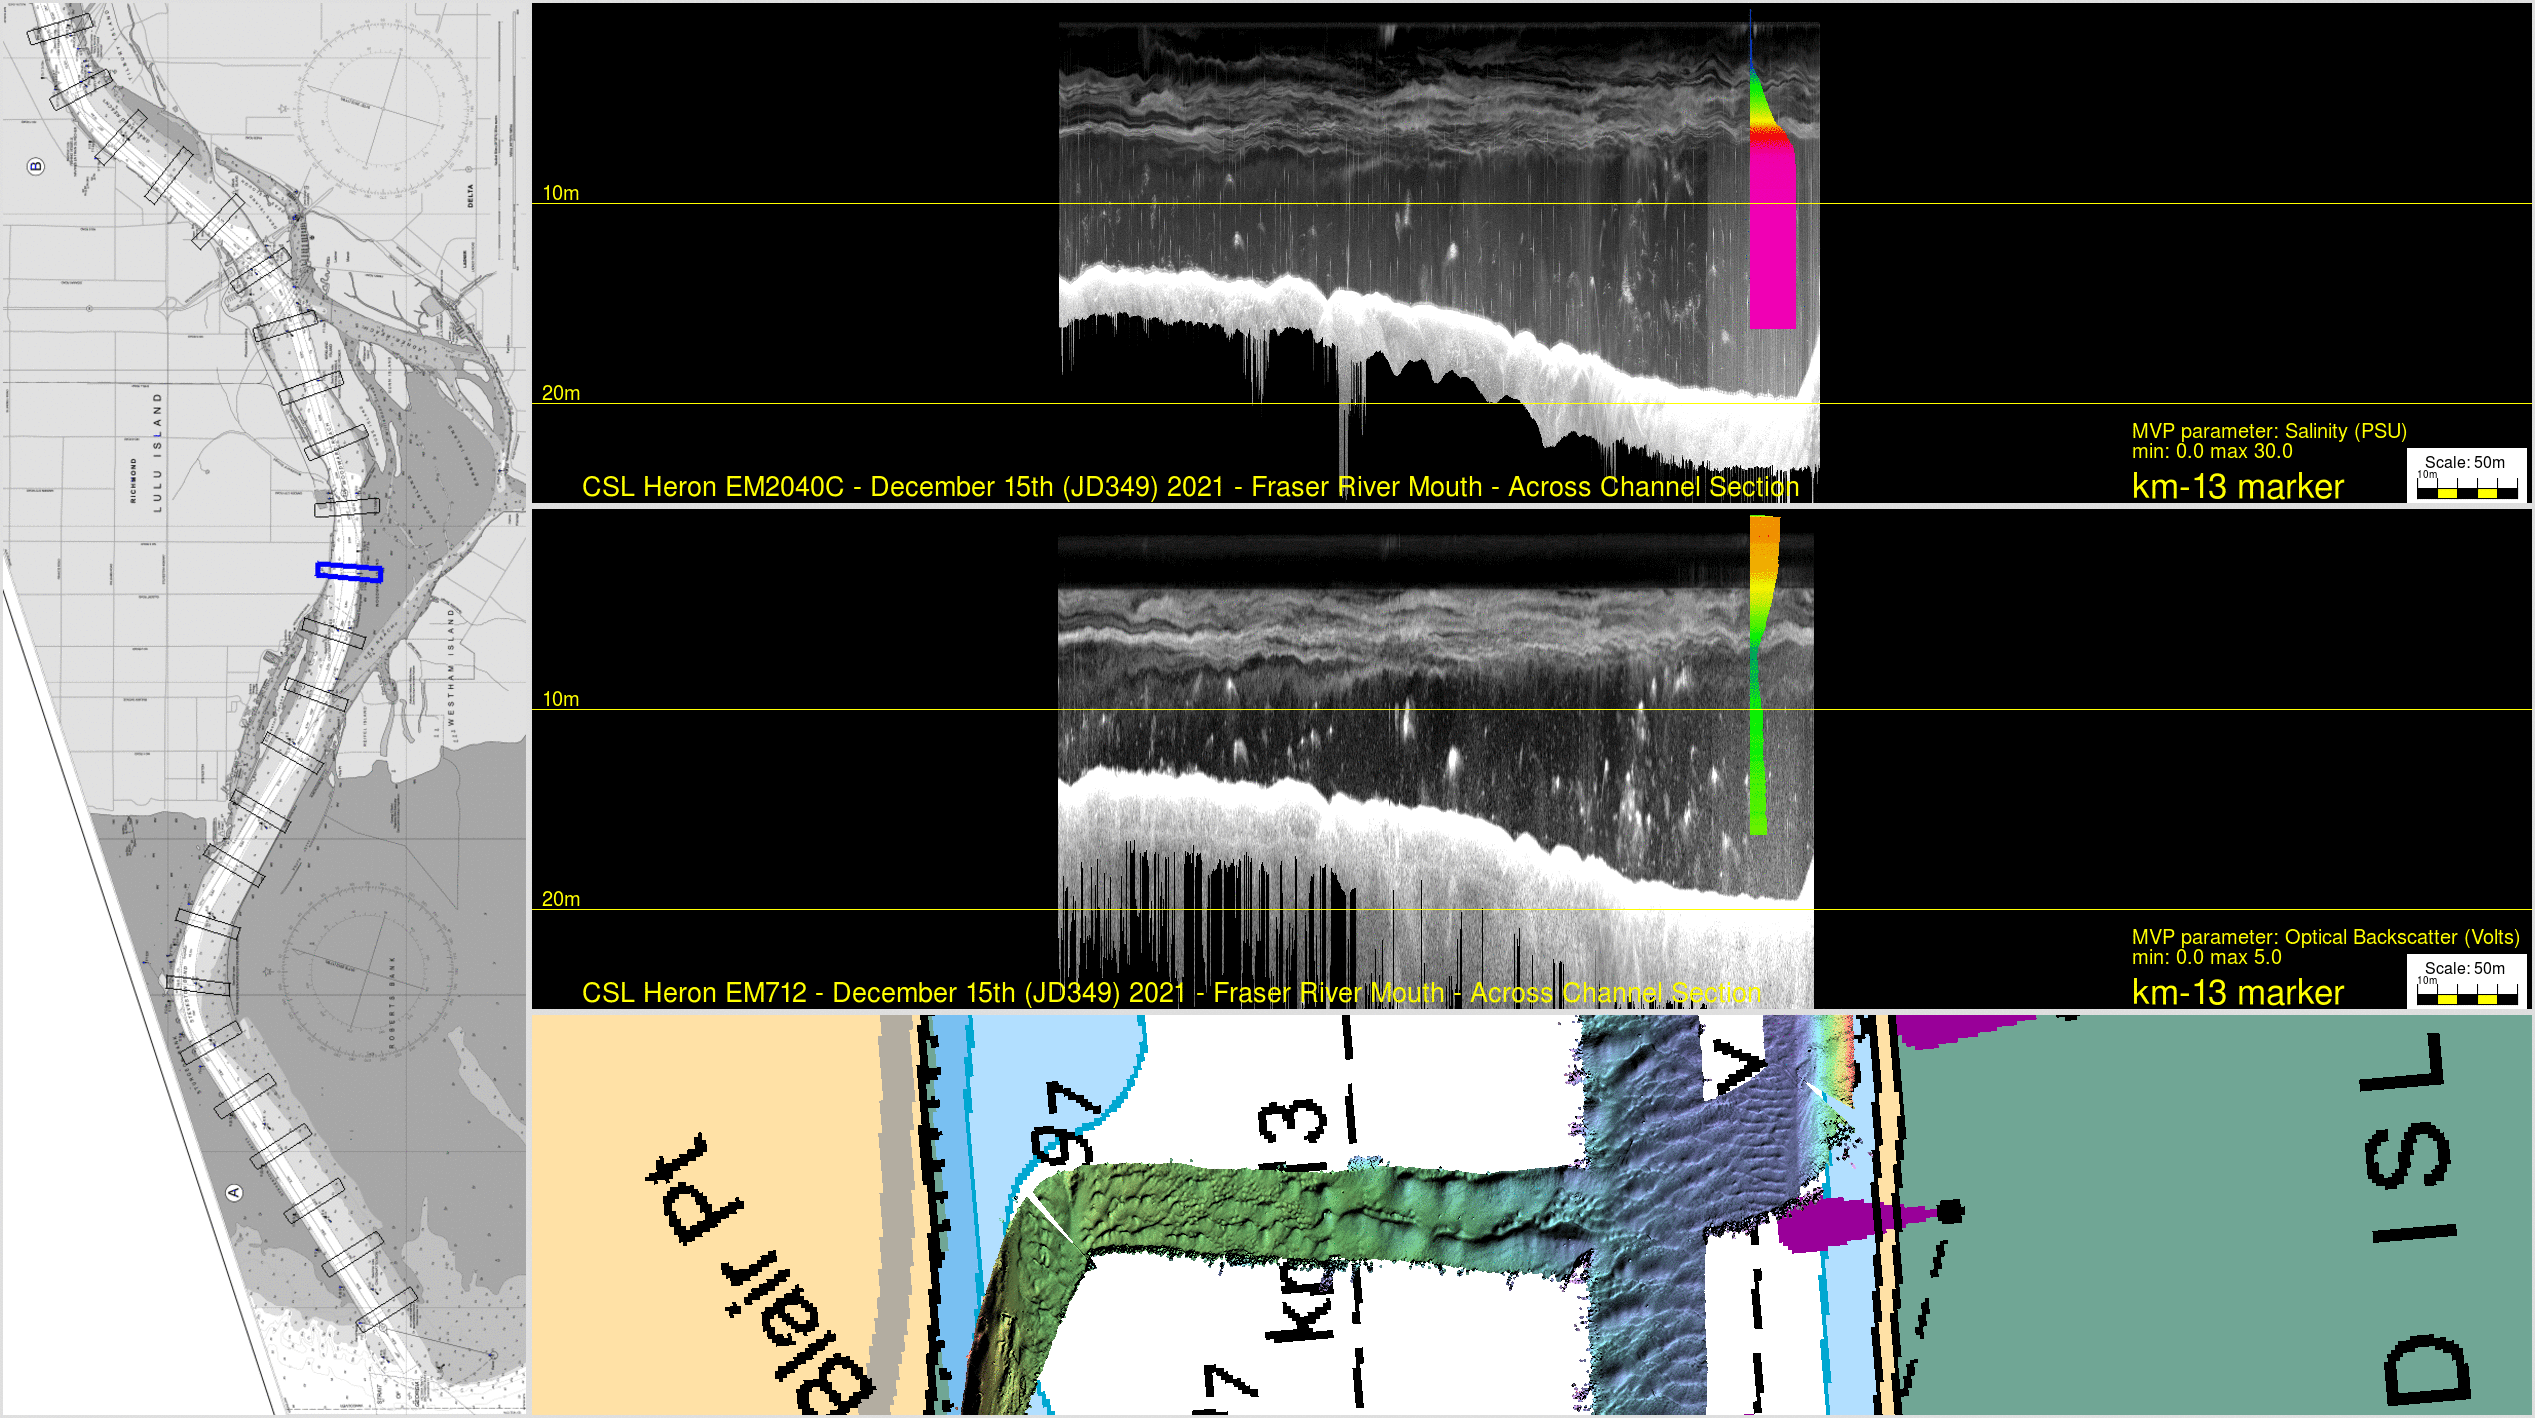
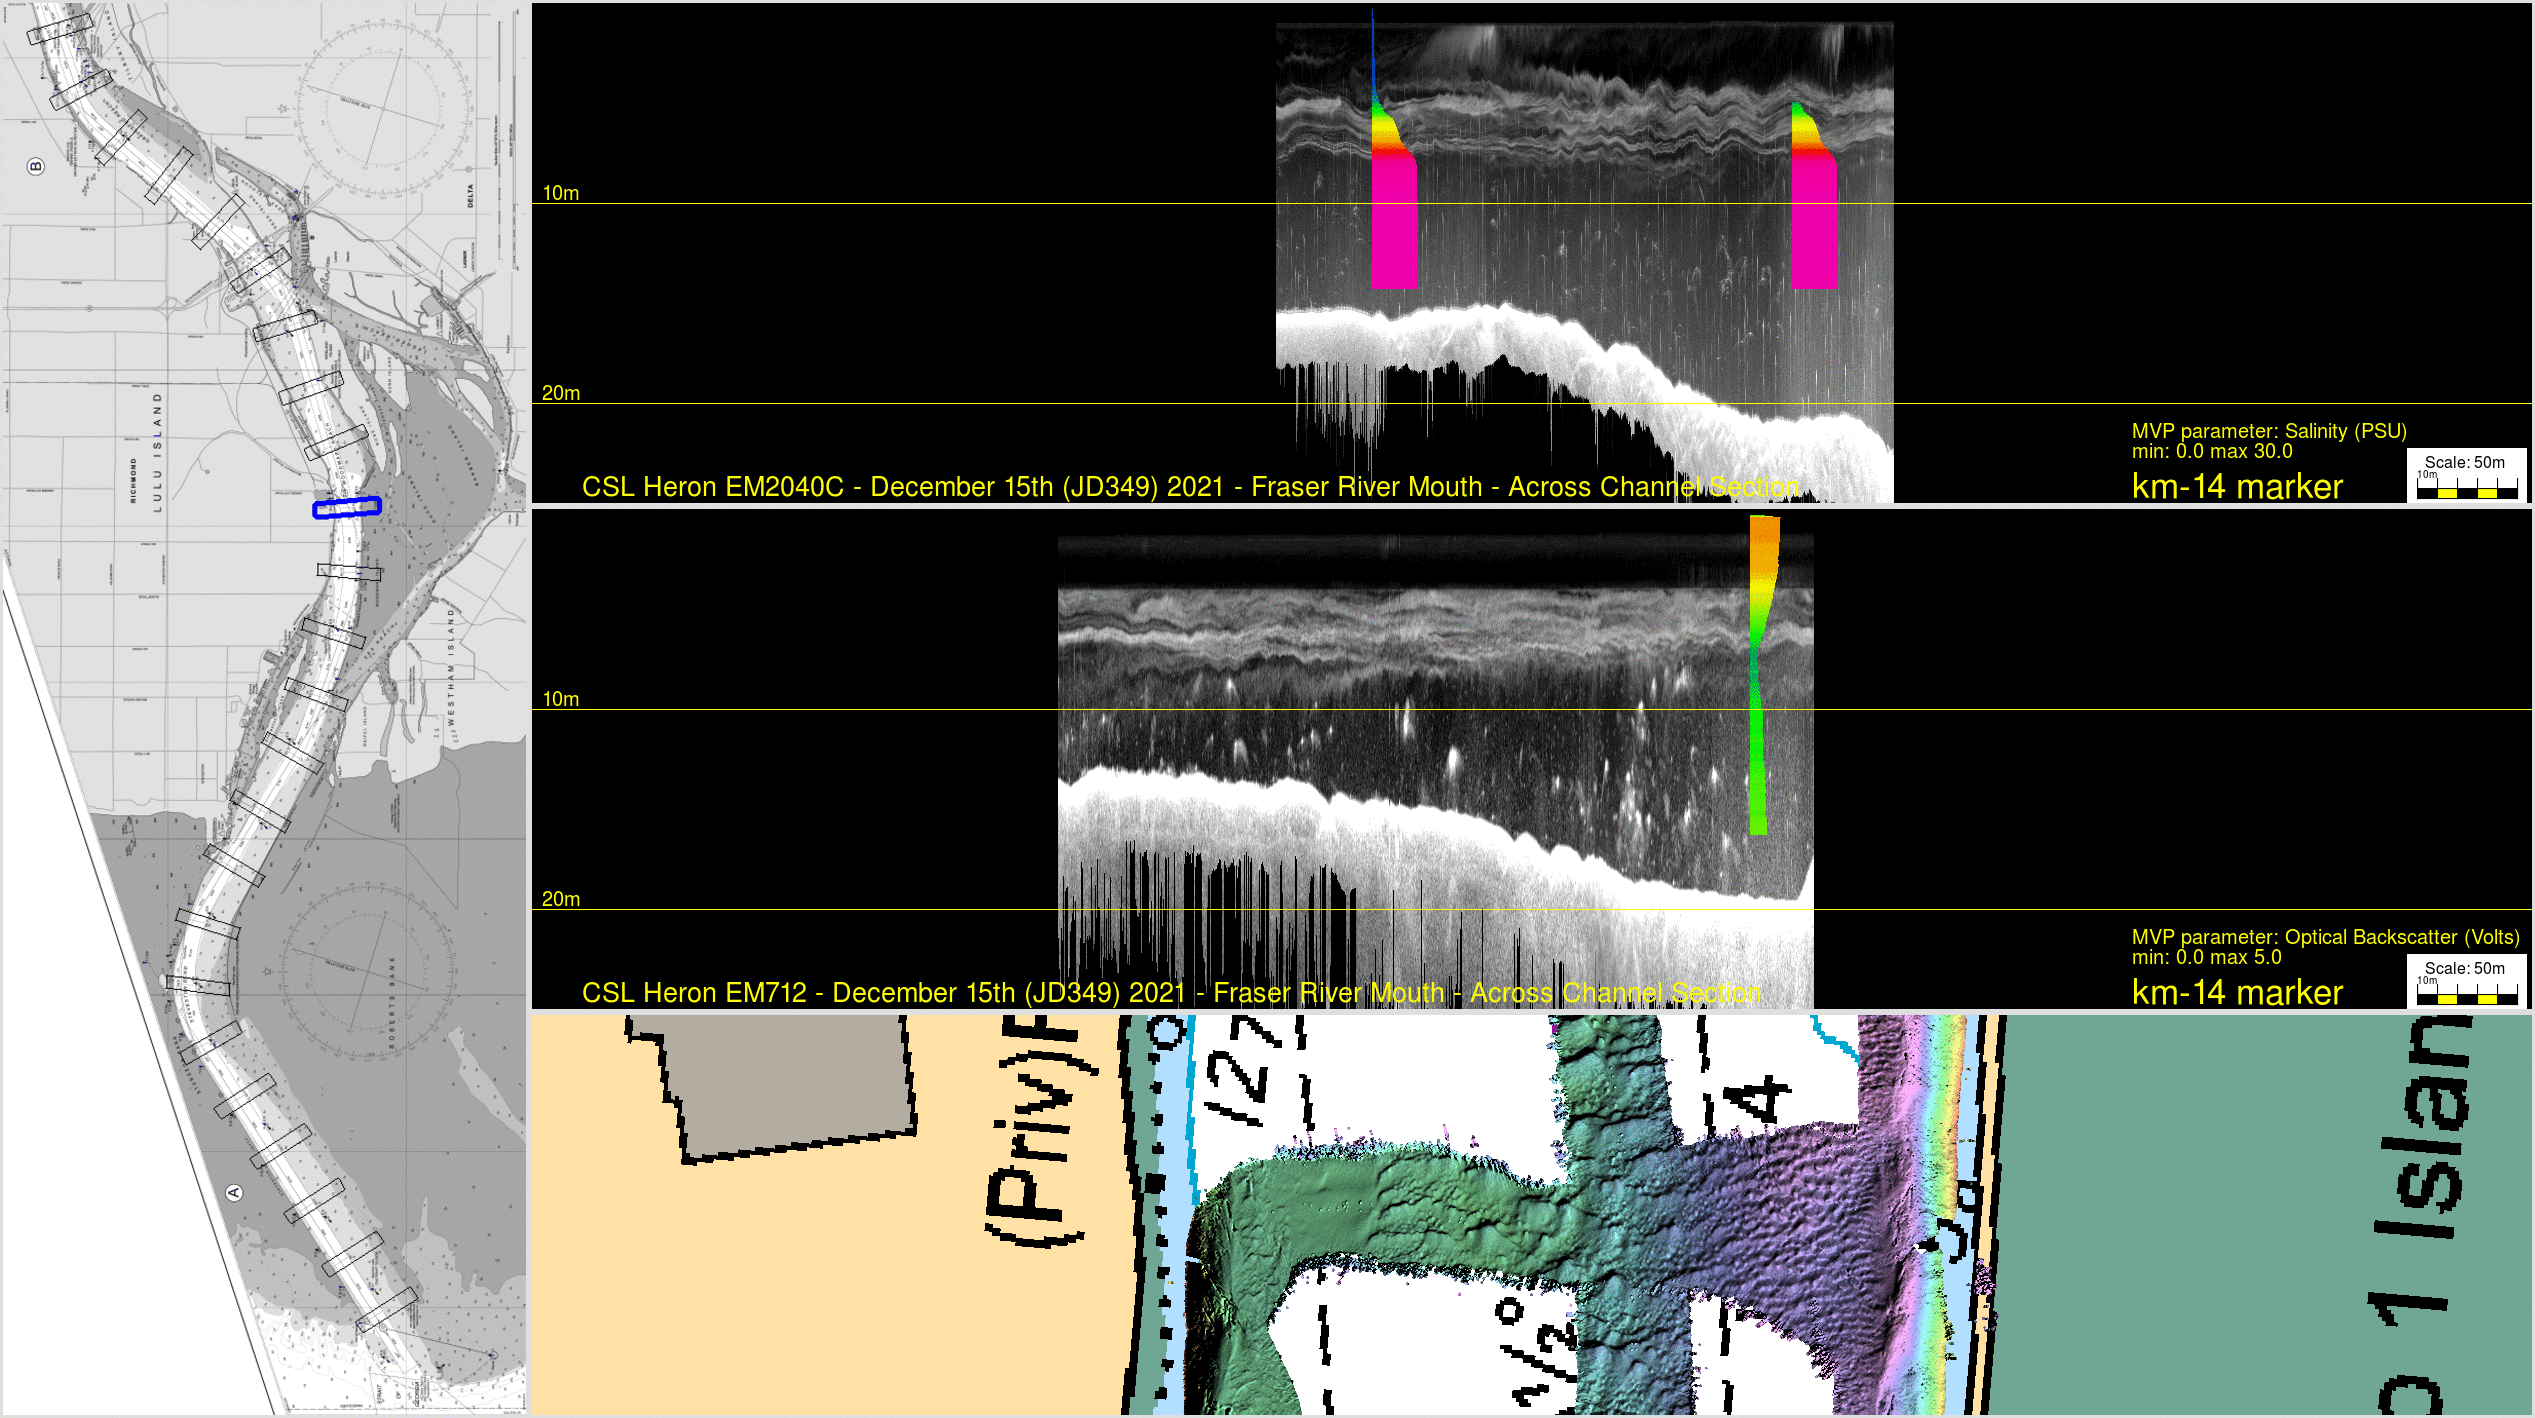
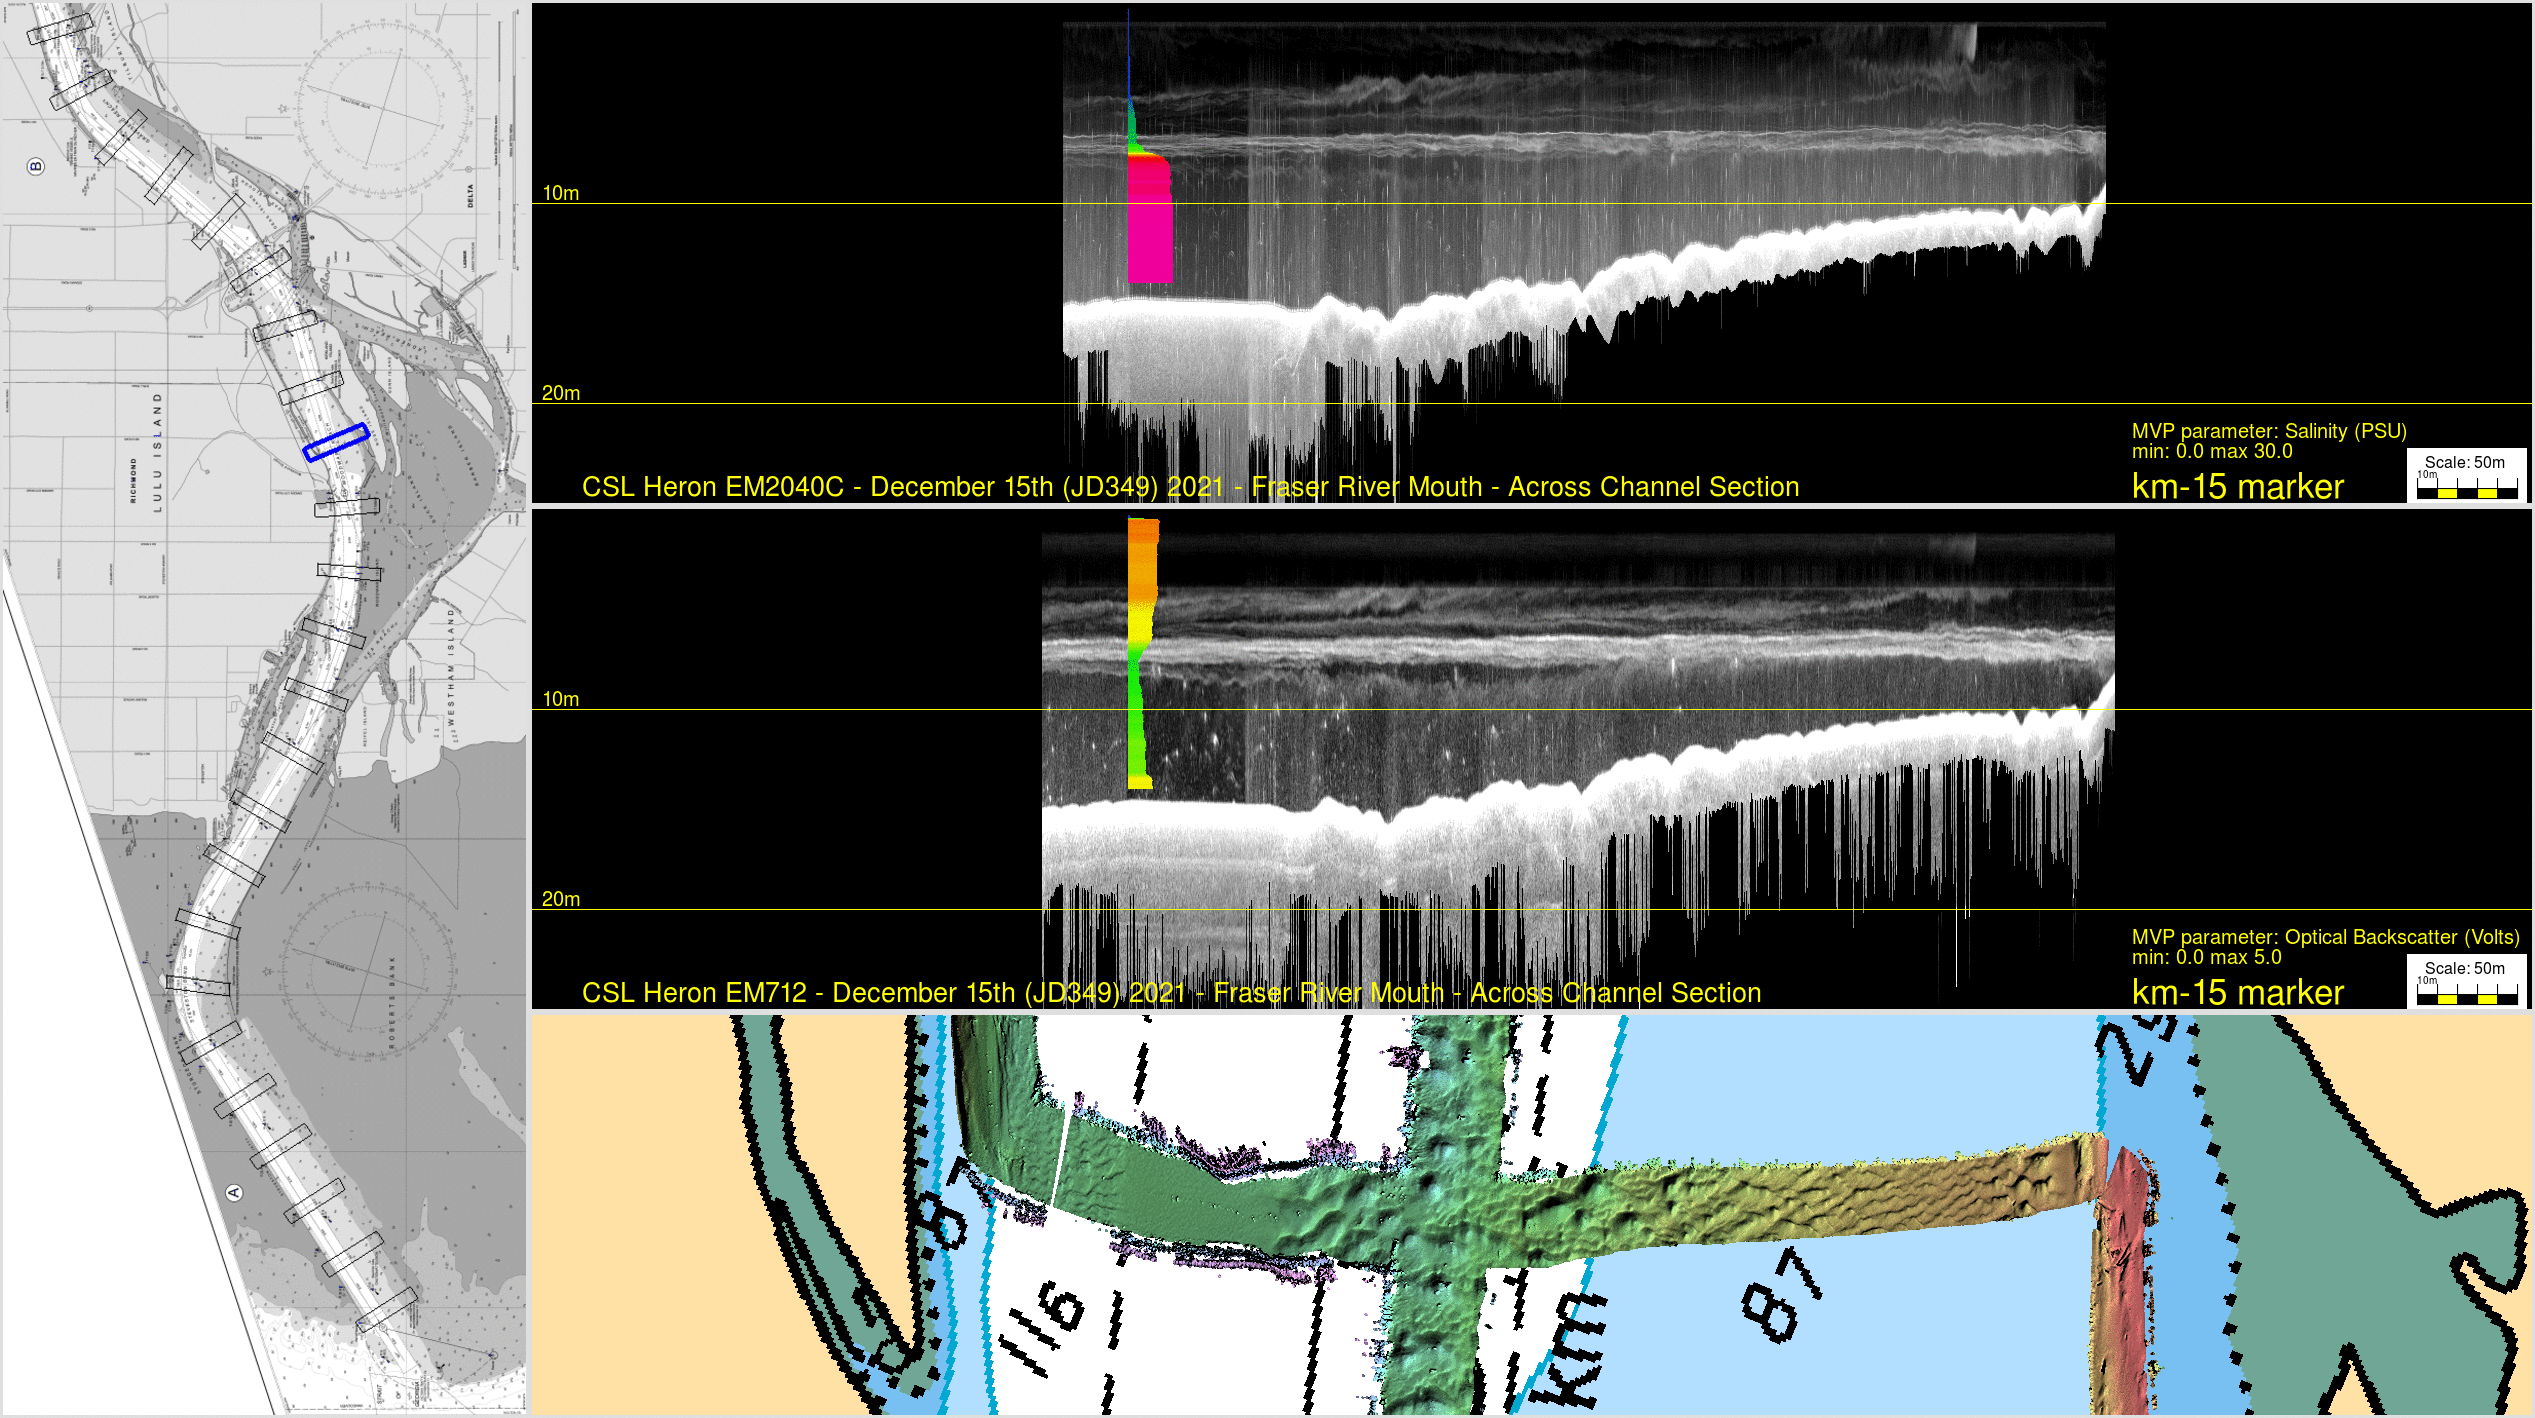
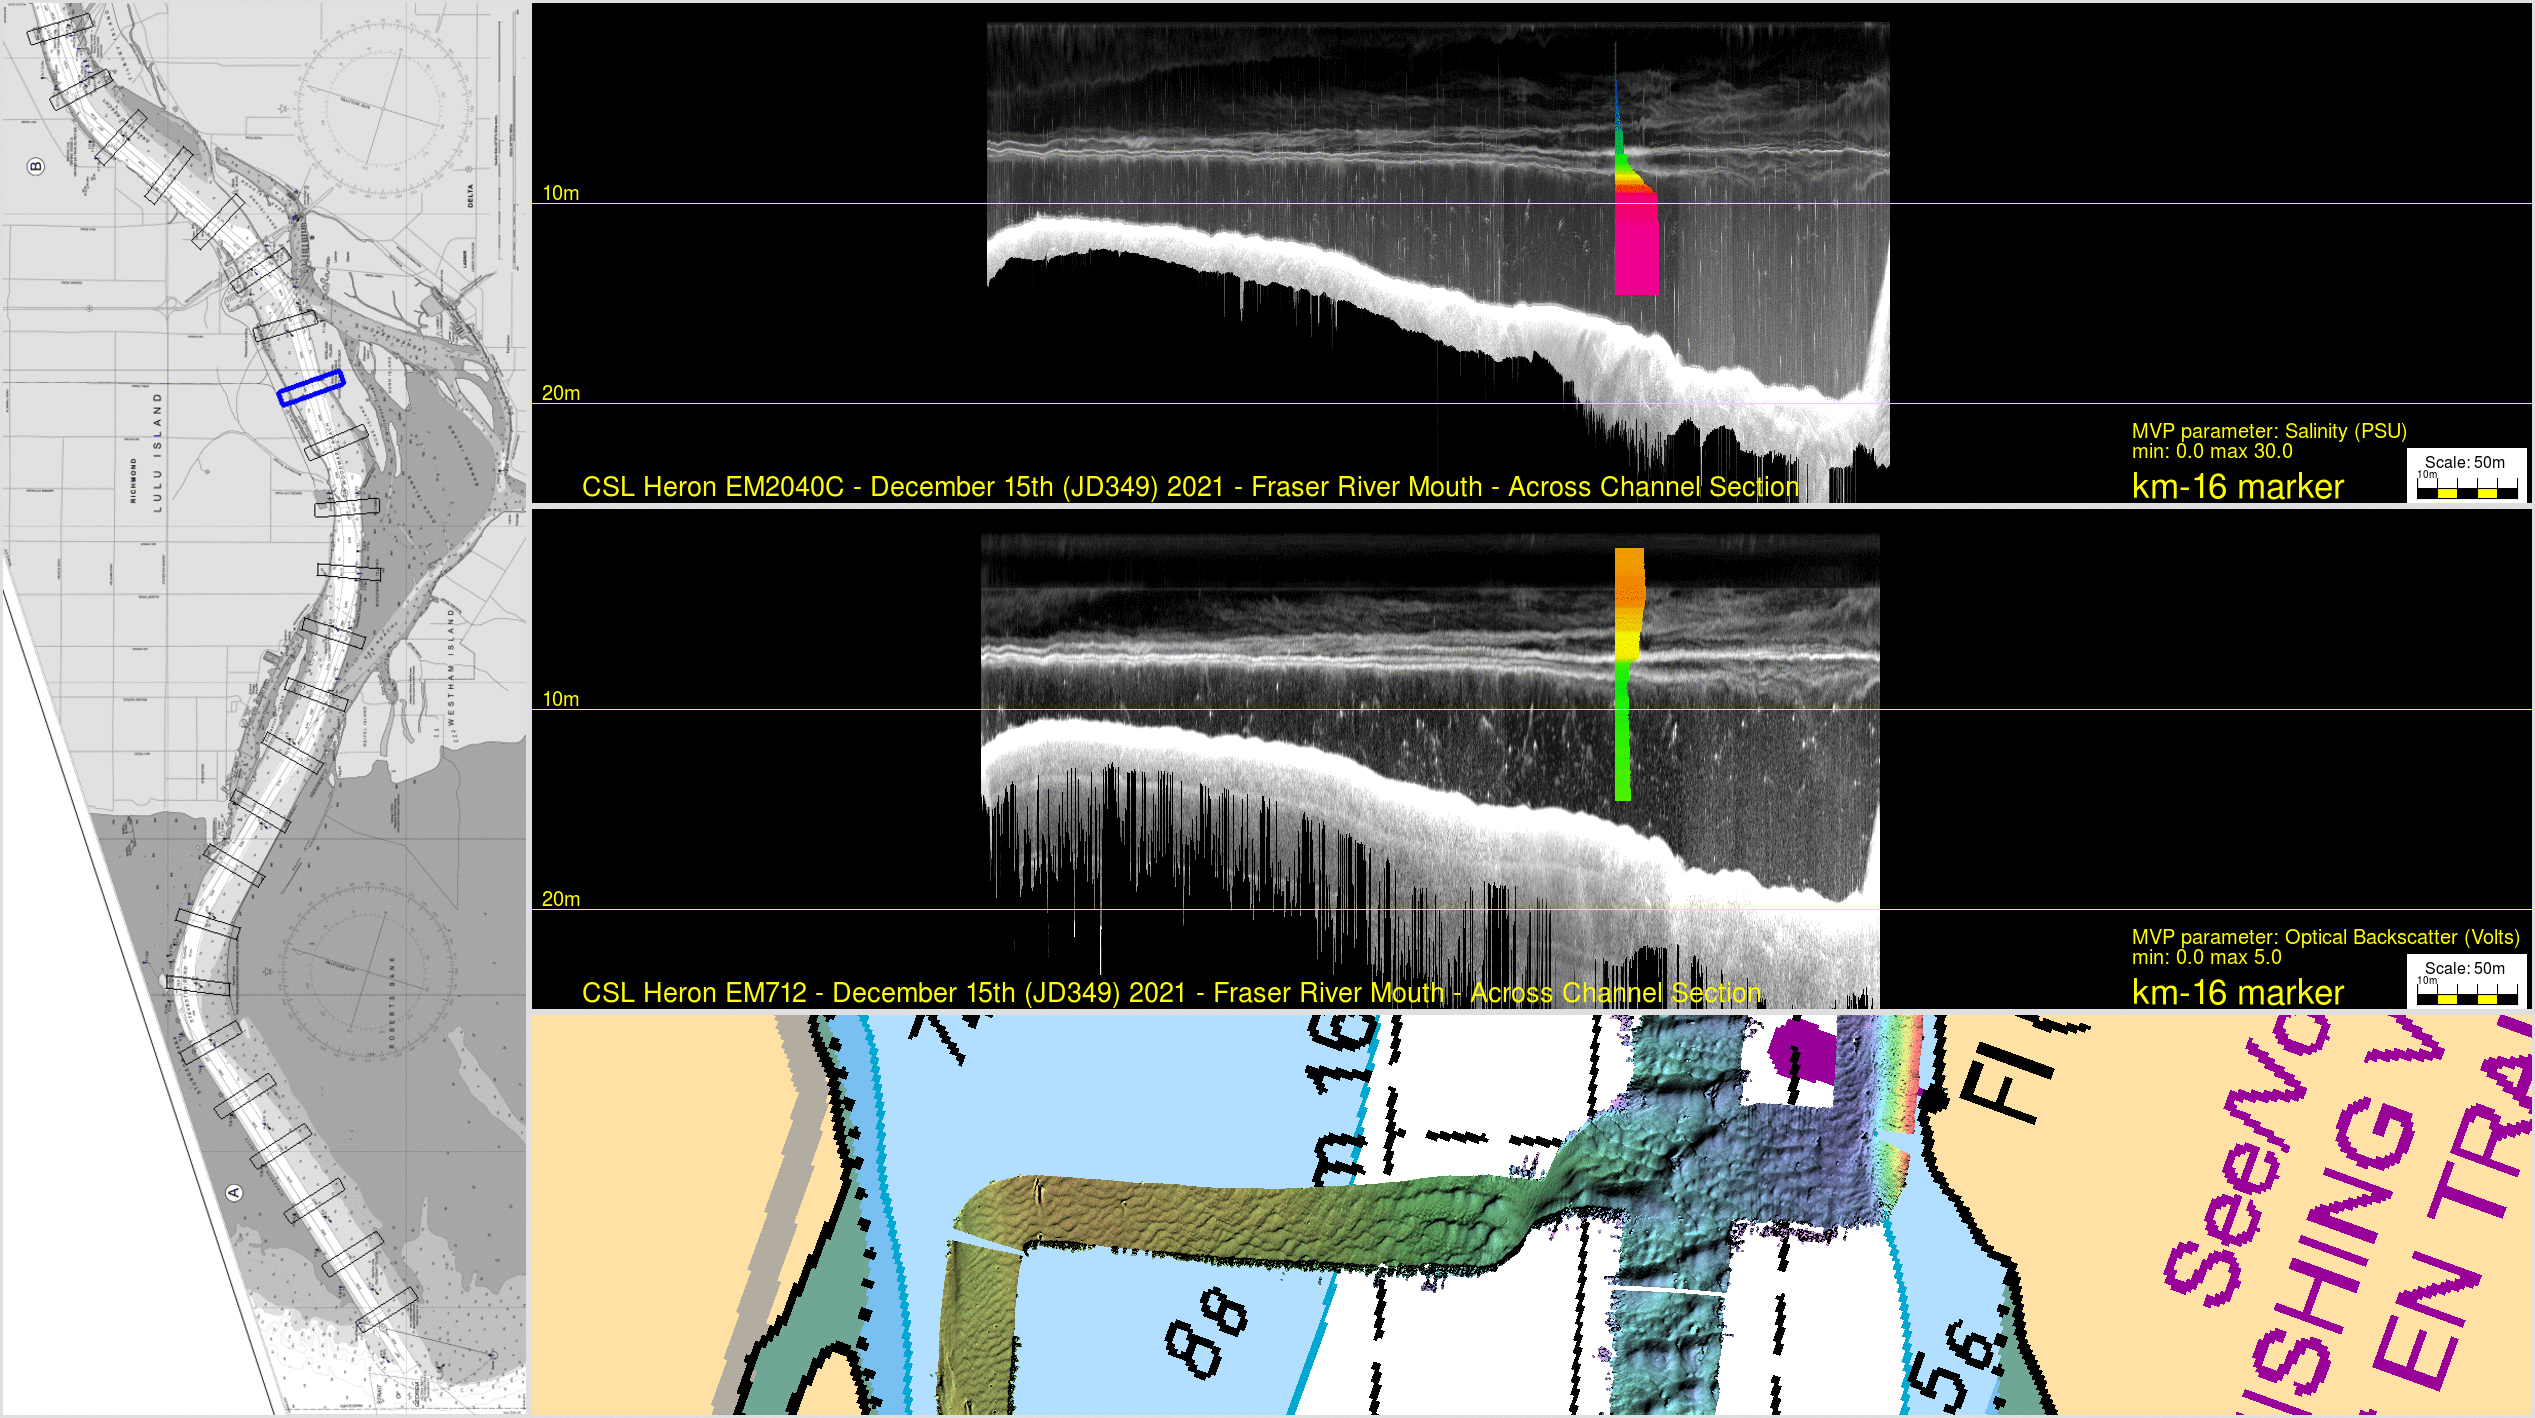
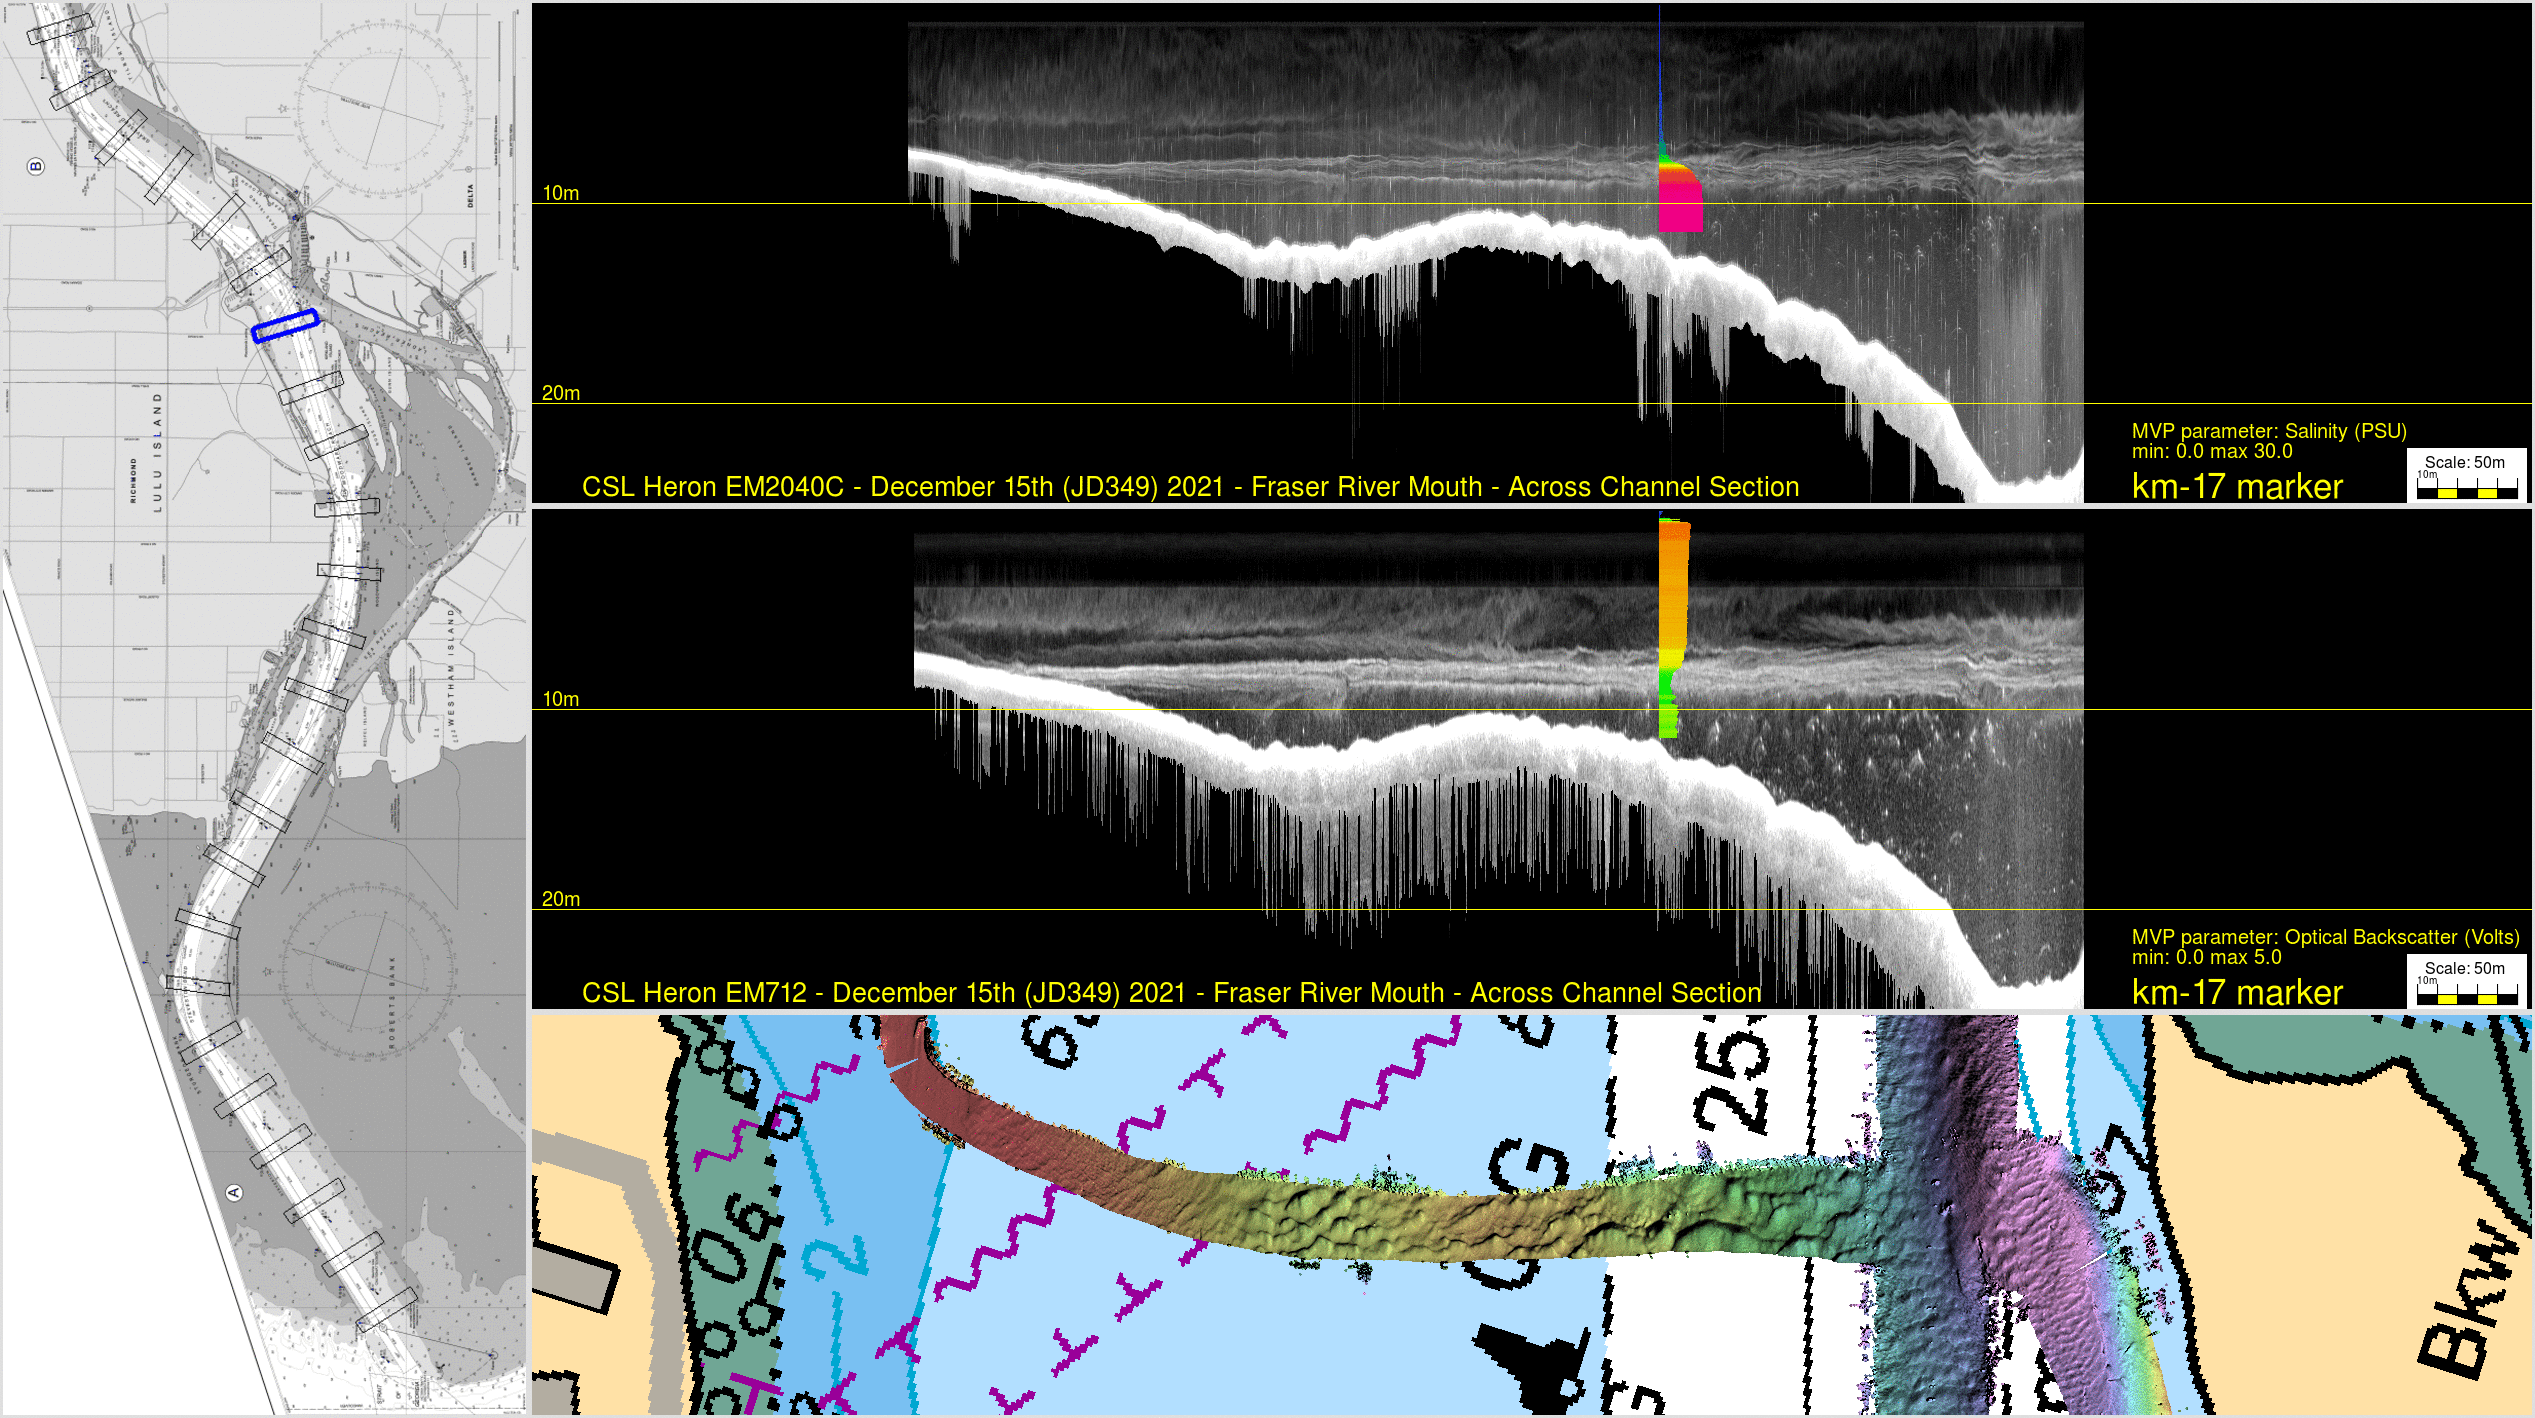
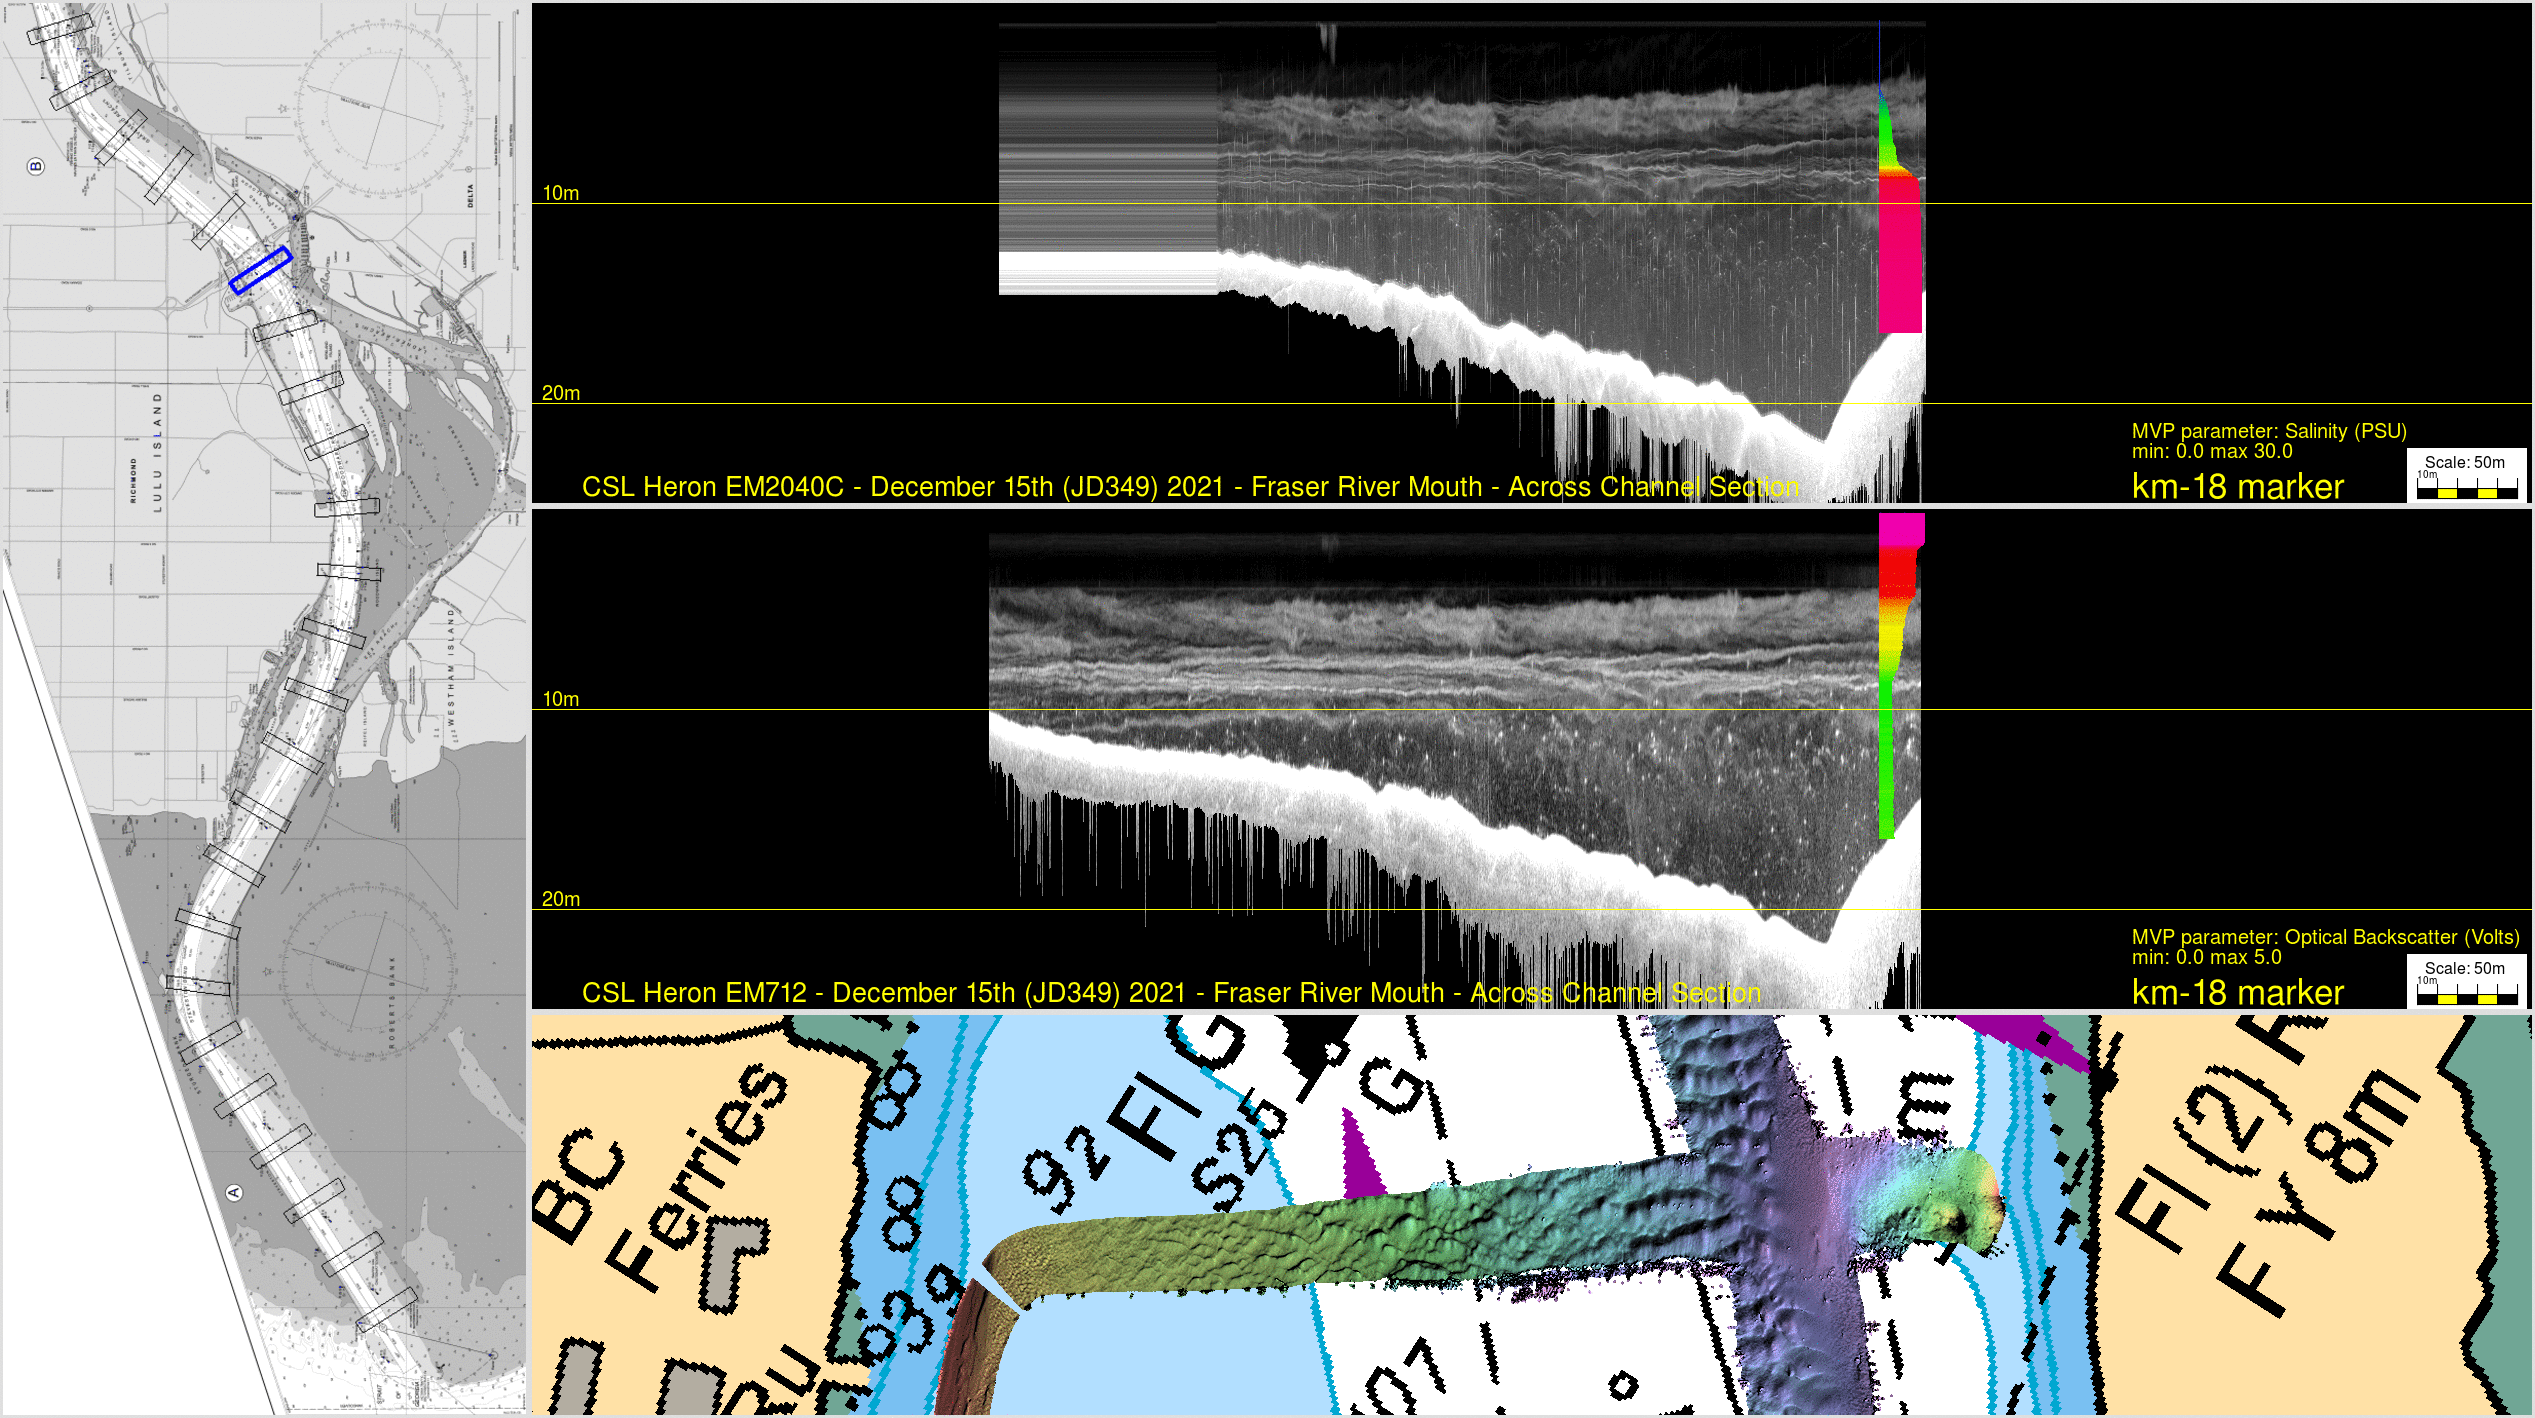
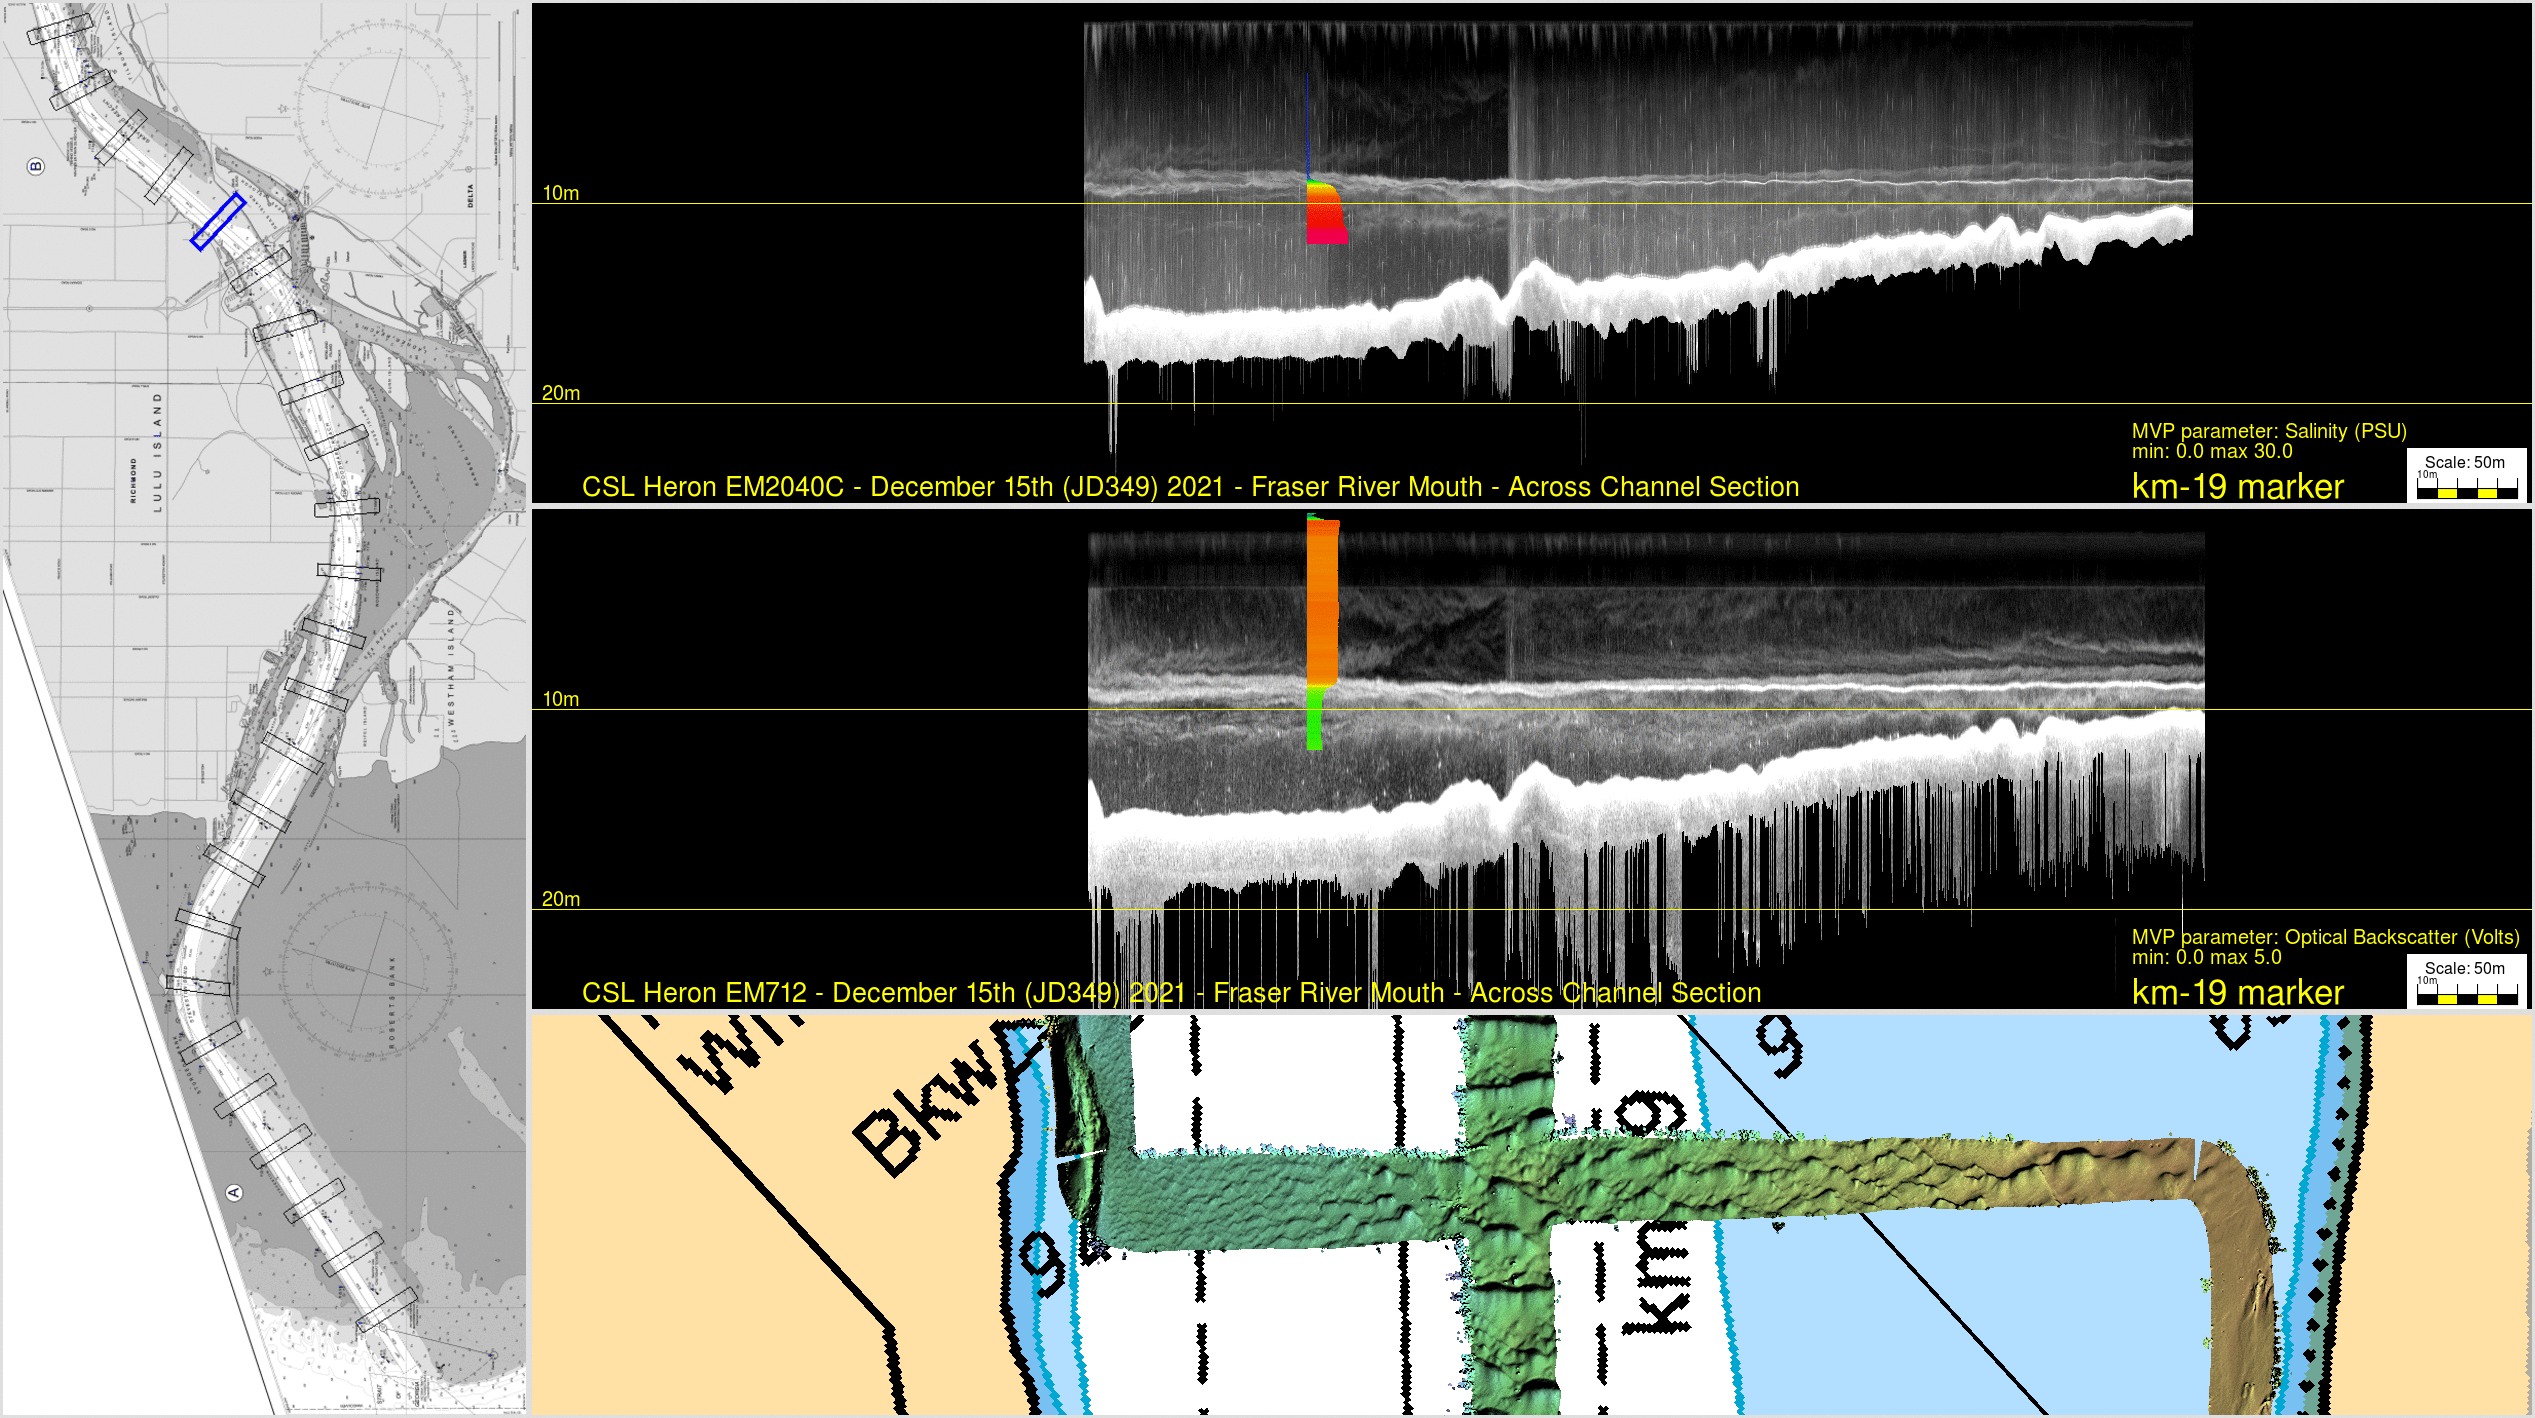
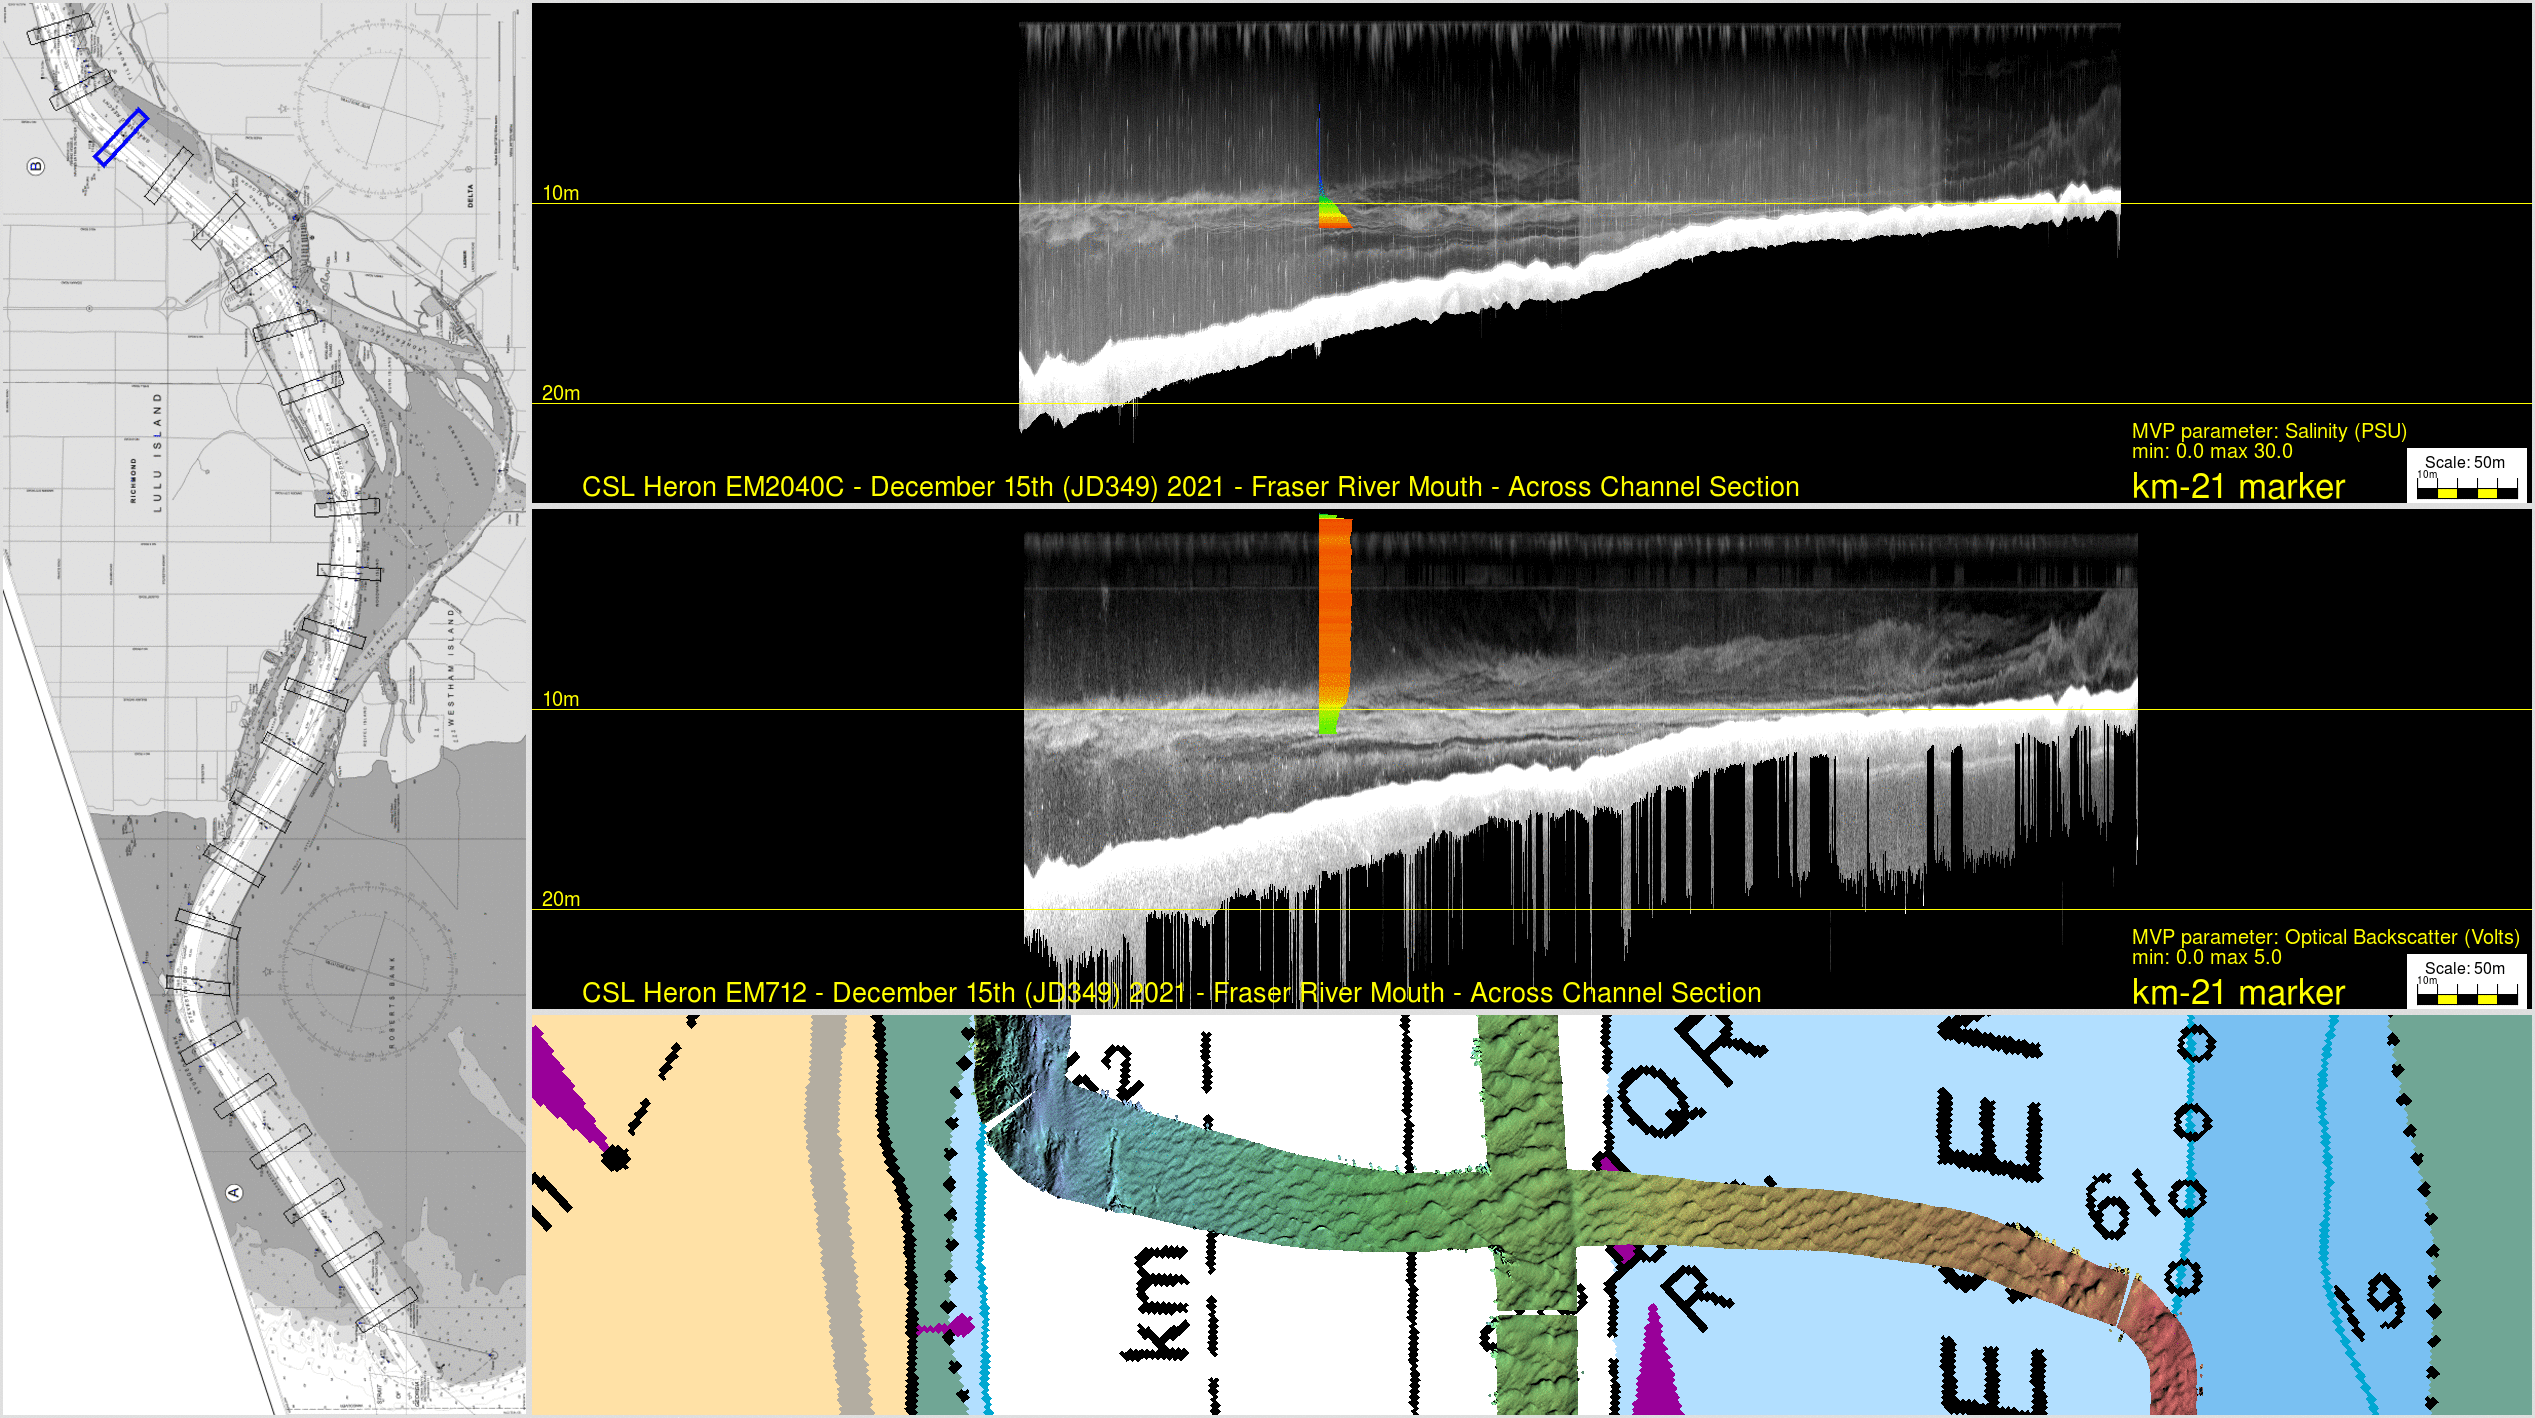
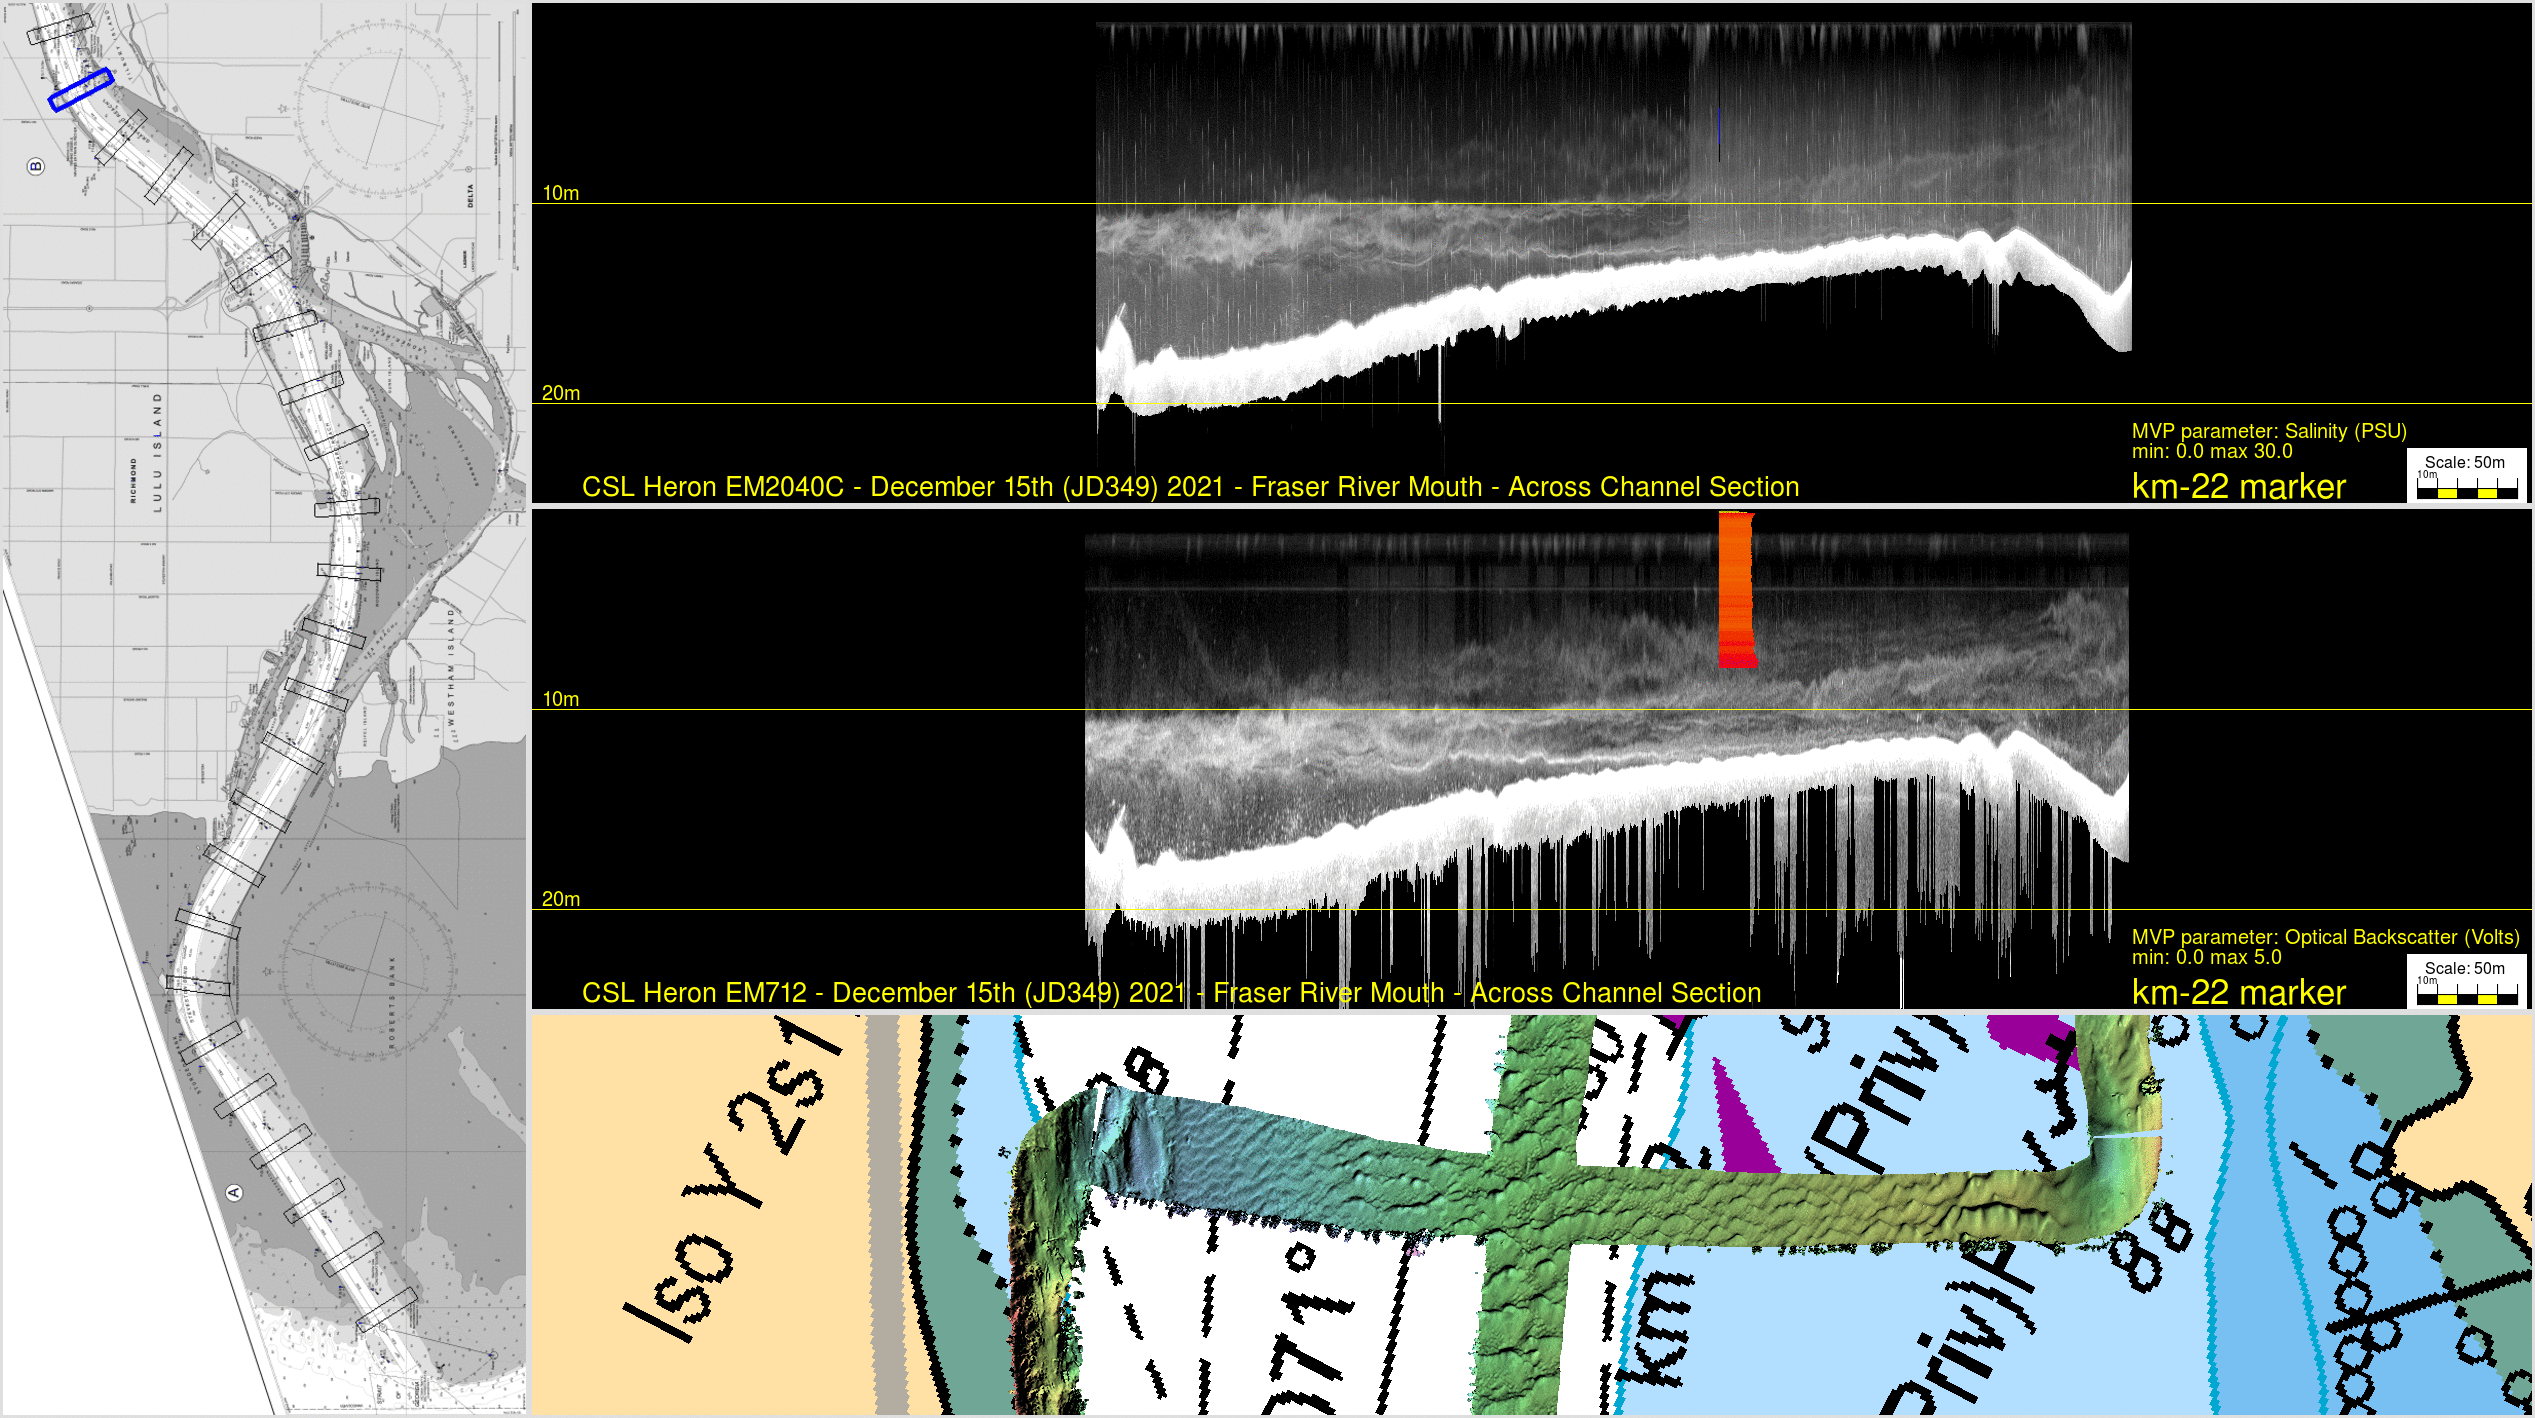
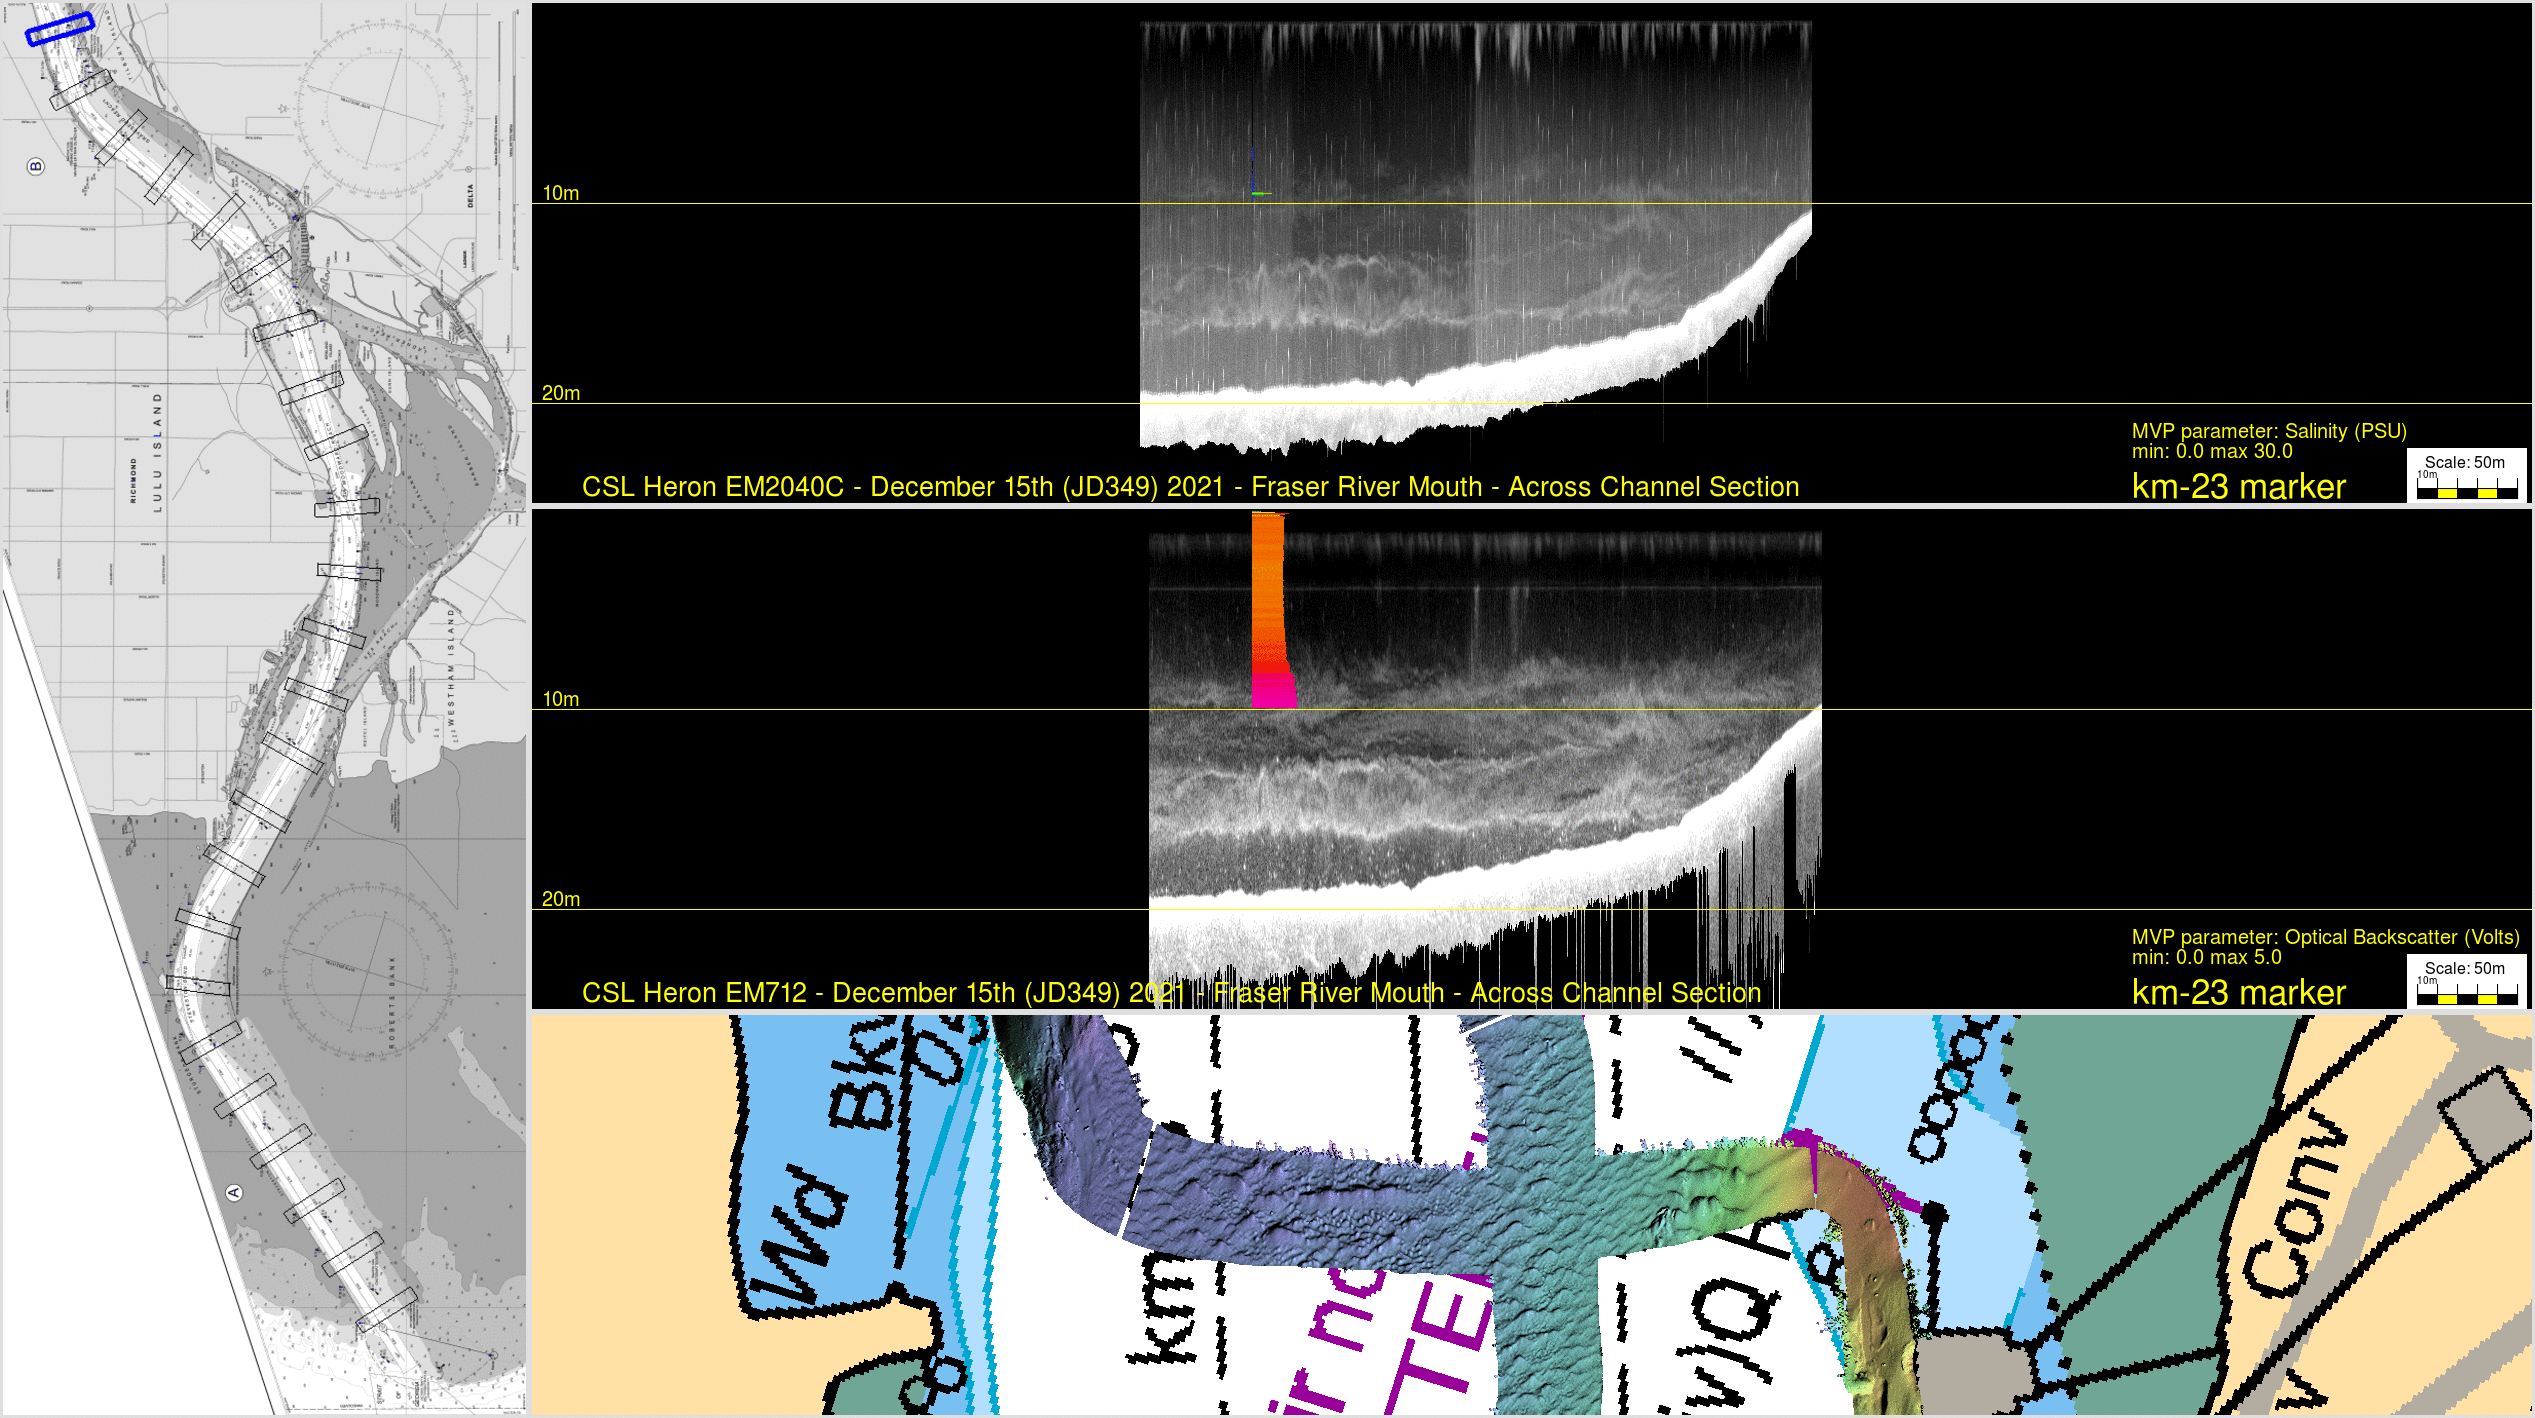
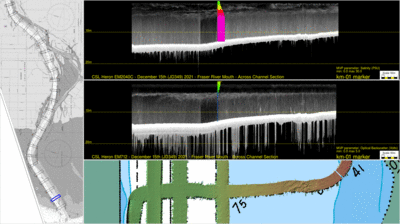
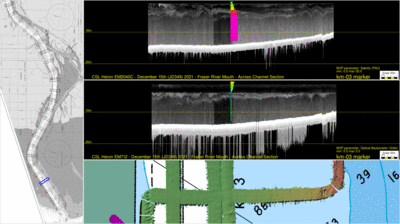
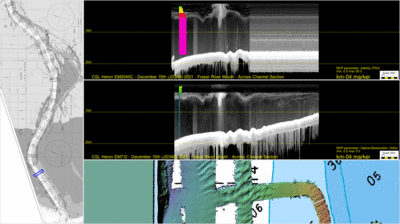
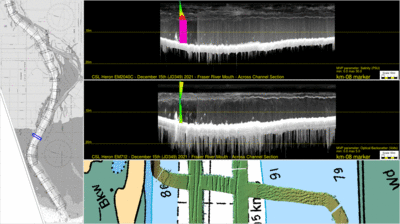
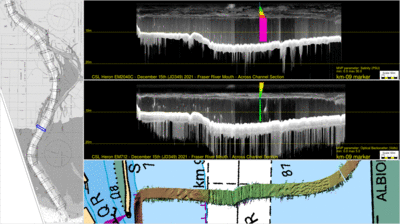
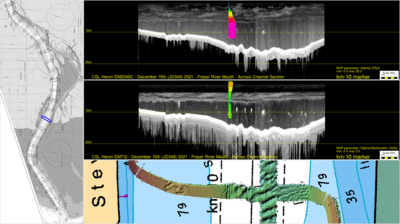
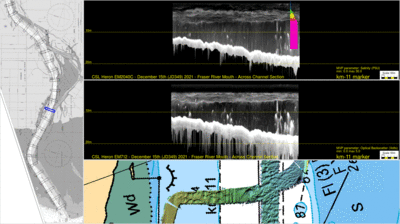
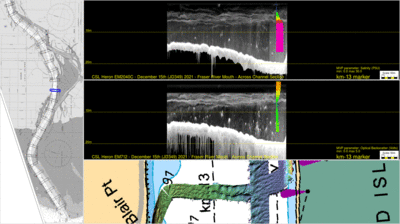
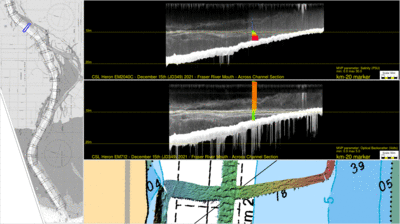
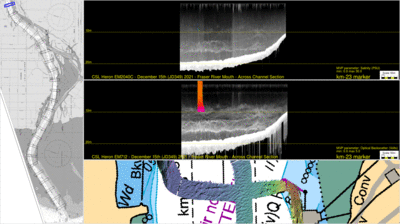
Across-Channel Cross Sections
Previous studies of the salt wedge have generally assumed that is is
a two dimensional structure evolving primarily along the
longitudinal length of the main channel. That channel however, is
both sinuous, and has an irregular cross-section and thus the flow
may also be varying significantly across the channel. To examine
this, 23 cross sections were collected at one kilometer spacing
(corresponding to the navigational km markers) along the length
examined.
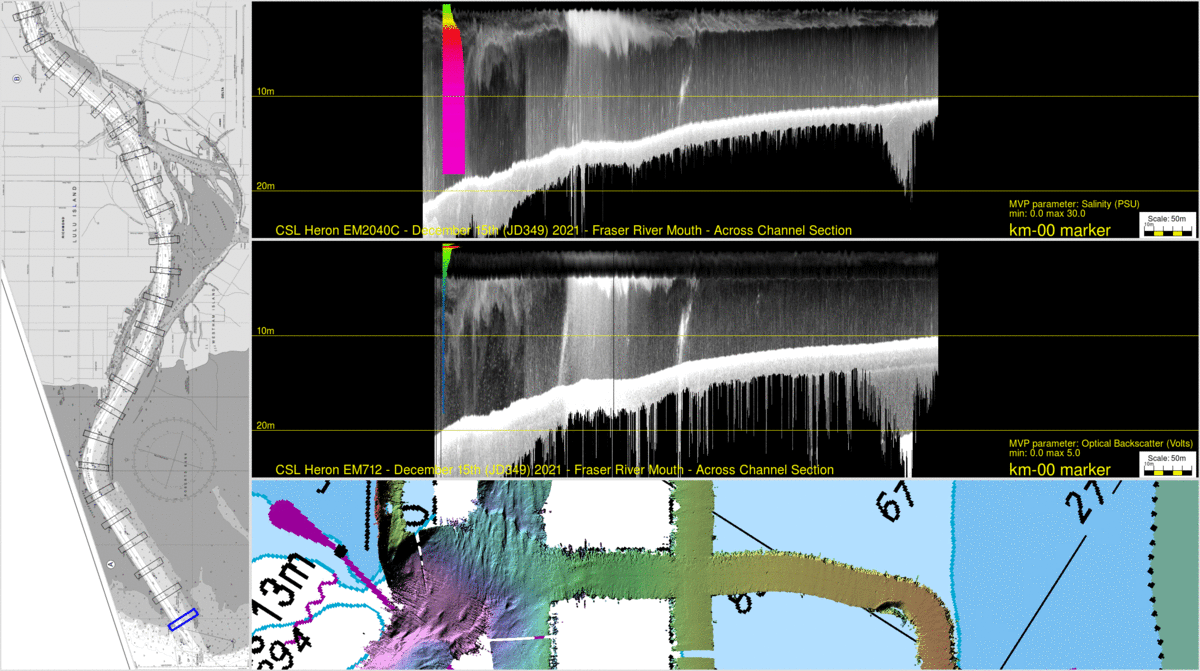
animation stepping through the 24 cross-sections collected. For
each the following plots are illustrated:
- top - EM2040C 300 kHz volume scattering - with MVP dip
salinity superimposed
- centre - EM712 ~80 kHz volume scattering - with MVP dip
optical backscatter superimposed
- bottom - EM2040C bathymetry of section (1000m wide).
Each Section, collected at 1 kilometer intervals is presented
separately below - showing the section as seen by each frequency
range, and with the singular MVP dip superimposed, showing either
the salinity profile, or the optical backscatter (suspended
sediment) profile.
Note particularly, Km marker 04 - the section was done just after
one of the large Seaspan ro-ro container ferries had passed. Note
the clear propeller wake and the two sub-surface bow wakes on the
halocline on either side. Other examples of similar apparent
undulations in the halocline occur at km marker 03, 12 and 14.
Interestingly, section 04 was acquired immediately behind a ferry
after waiting for it to pass. And Section 03 was acquired a few
minutes later downstreram and thus it may be imaging the wake wave
as it propagates to the side of the channel.
km - 00

|
km - 01
 |
km - 02
 |
km - 03
 |
km - 04
 |
km - 05
 |
km - 06
 |
km - 07
 |
km - 08
 |
km - 09
 |
km - 10
 |
km - 11
 |
km - 12
 |
km - 13
 |
km - 14
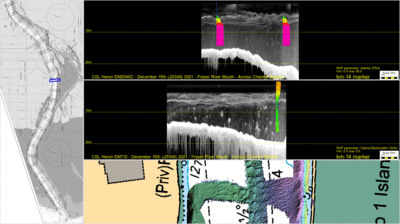 |
km - 15
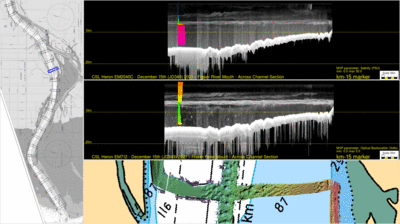 |
km - 16
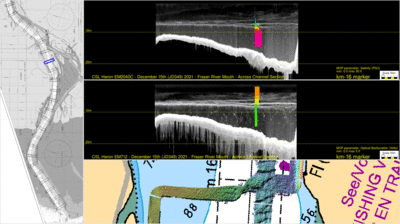 |
km - 17
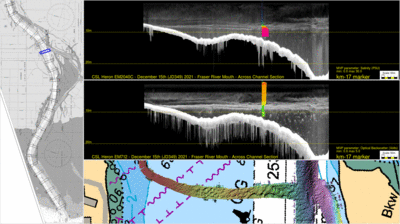 |
km - 18
 |
km - 19
 |
km - 20
 |
km - 21
 |
km - 22
 |
km - 23
 |
page developed by JEHC, January-February,
2022