Shippagan Bay Survey 2003 : 3.5 kHz
Subbottom Profiles.
These 5 images were deliberately made with a rotation angle of 27.5 degrees to align with the survey orientation so that subbottom profile "fence diagrams" could be constructed. Each map sheet is at 2m resolution (degraded from the full 1m resolution). The matching registered images of :
- CHS chart 4913
- SNB orthophotos
- EM3000 bathymetry
- EM3000 backscatter
- Knudsen 200 kHz sidescan
are provided for referencing
purposes.
For each area, all the 3.5 kHz subbottom profiles are presented as a fence diagram. The diagram allolws one to view all the profiles in a pseudo-3D context to see the continuation of subsurface features from line to line geographically across the area of interest.
For each area, all the 3.5 kHz subbottom profiles are presented as a fence diagram. The diagram allolws one to view all the profiles in a pseudo-3D context to see the continuation of subsurface features from line to line geographically across the area of interest.
Seaward of Caraquet Island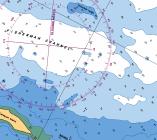 |
Northern Shippagan Bay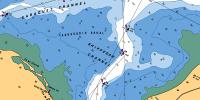 |
Central Shippagan Bay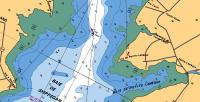 |
Lameque Bay 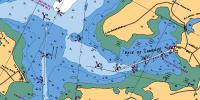 |
St. Simon Bay.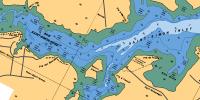 |