using CHS archived single beam:
Preparations for the CCGS Amundsen 2004 transit.
John E. Hughes Clarke
Ocean Mapping Group
University of New Brunswick
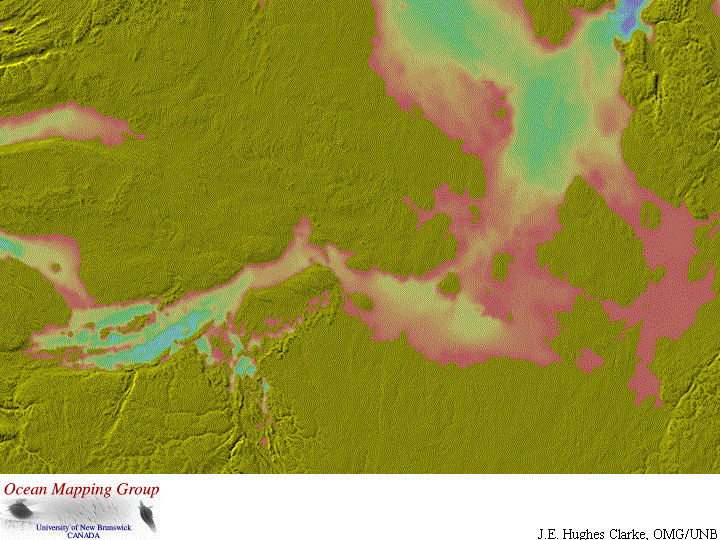
Most regional images of the bathymetry of the NorthWest
Passage are based on coarse resolution gridded products derived from variable
density source data. The IBCAO data set is probably one of the most generally
stable. Underlying the interpolated surface within the passage are sounding
data sets primarily acquired by the Canadian Hydrographic Service.
These CHS data vary in age from the 60's to the 90's (no significant regional surveys have been done since the turn of the millenium). The data quality vary strongly , primarily in density, positioning accuracy and confidence in datums. For the Eastern Arctic and the Beaufort, the regional data is generally old and analog. Nevertheless a critical subset of the data has been acquired at higher resolution in the 80's and 90's. These data were primarily focussed on that section of the Passage that provides a potential bathymetric hazard to shipping. This area extends from Dolphin and Union Strait to Victoria Strait (including of course the route round the back of King William Island).
These CHS data vary in age from the 60's to the 90's (no significant regional surveys have been done since the turn of the millenium). The data quality vary strongly , primarily in density, positioning accuracy and confidence in datums. For the Eastern Arctic and the Beaufort, the regional data is generally old and analog. Nevertheless a critical subset of the data has been acquired at higher resolution in the 80's and 90's. These data were primarily focussed on that section of the Passage that provides a potential bathymetric hazard to shipping. This area extends from Dolphin and Union Strait to Victoria Strait (including of course the route round the back of King William Island).
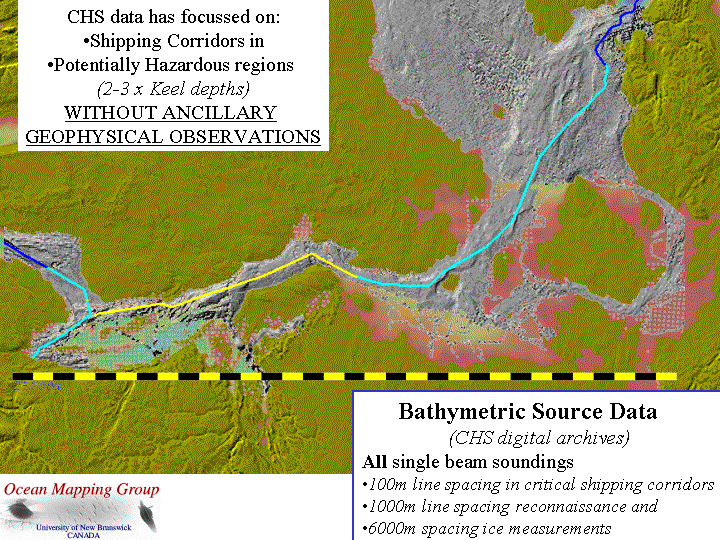
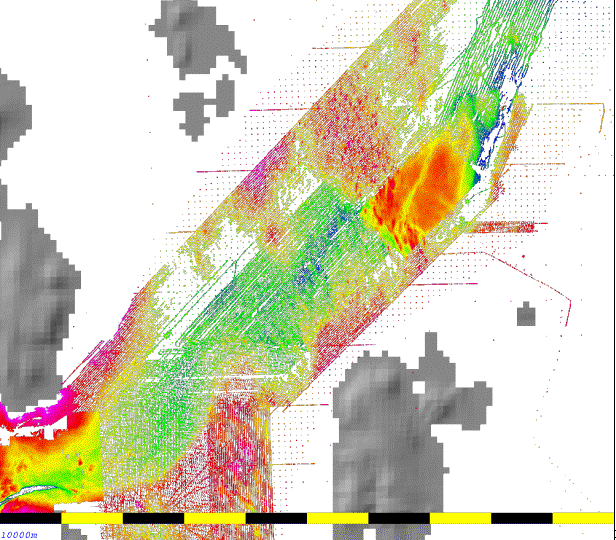
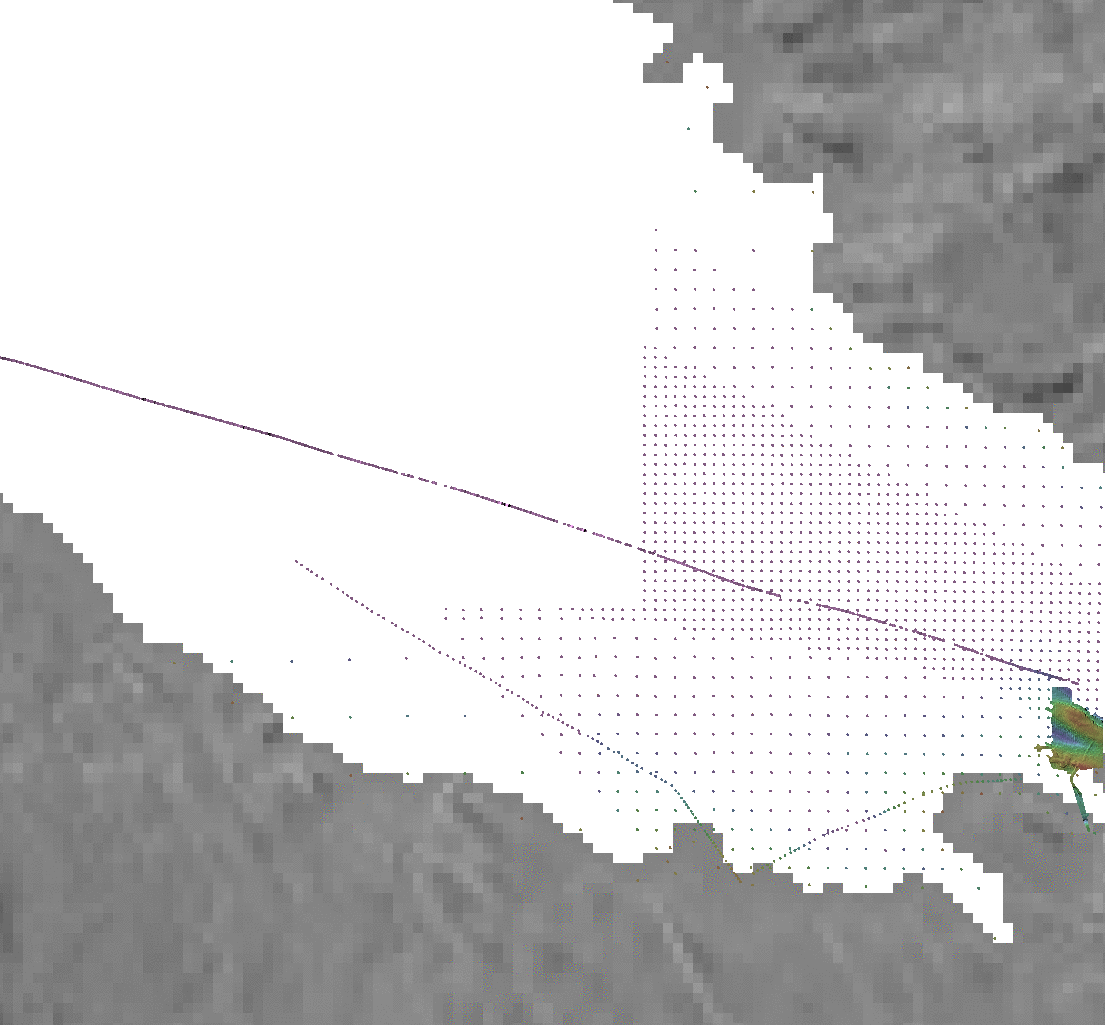
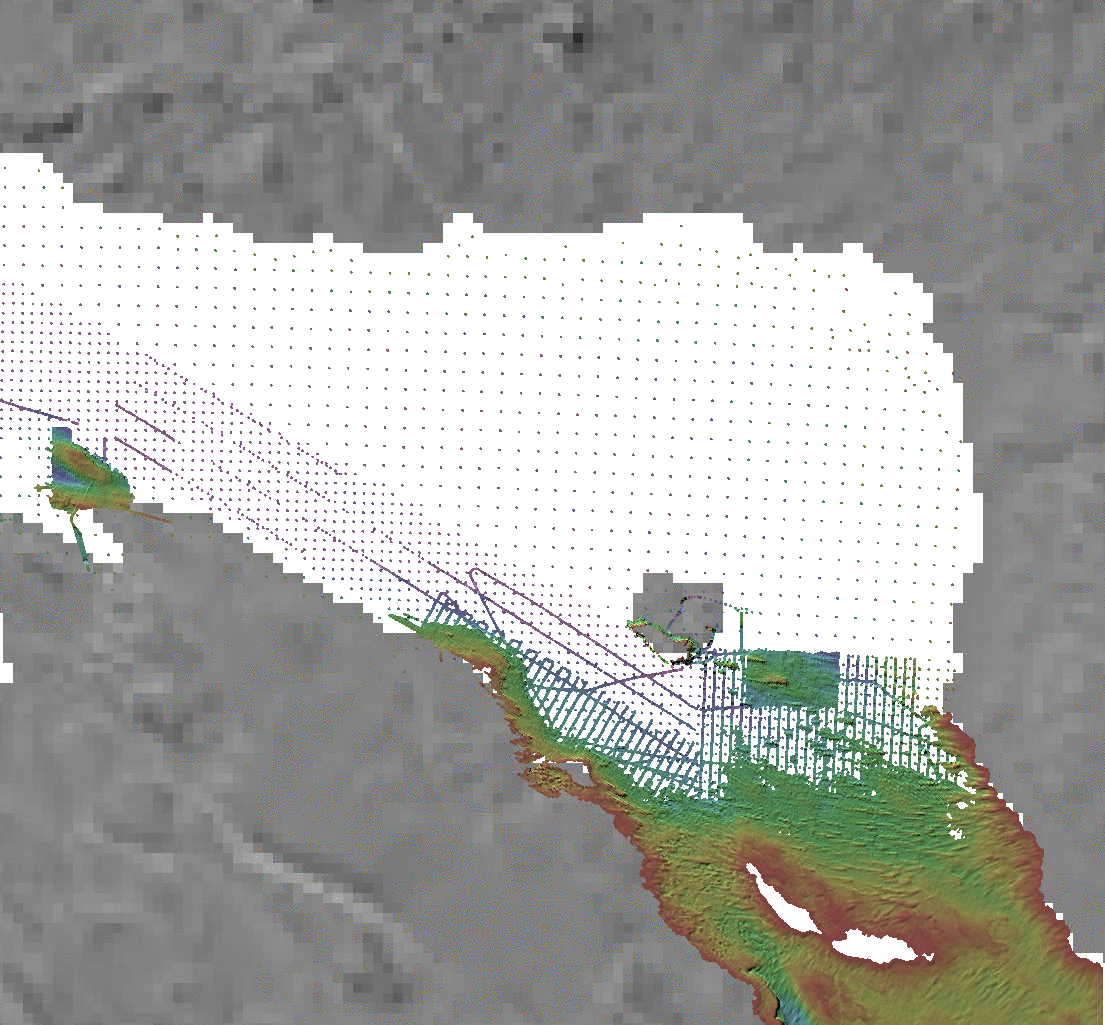
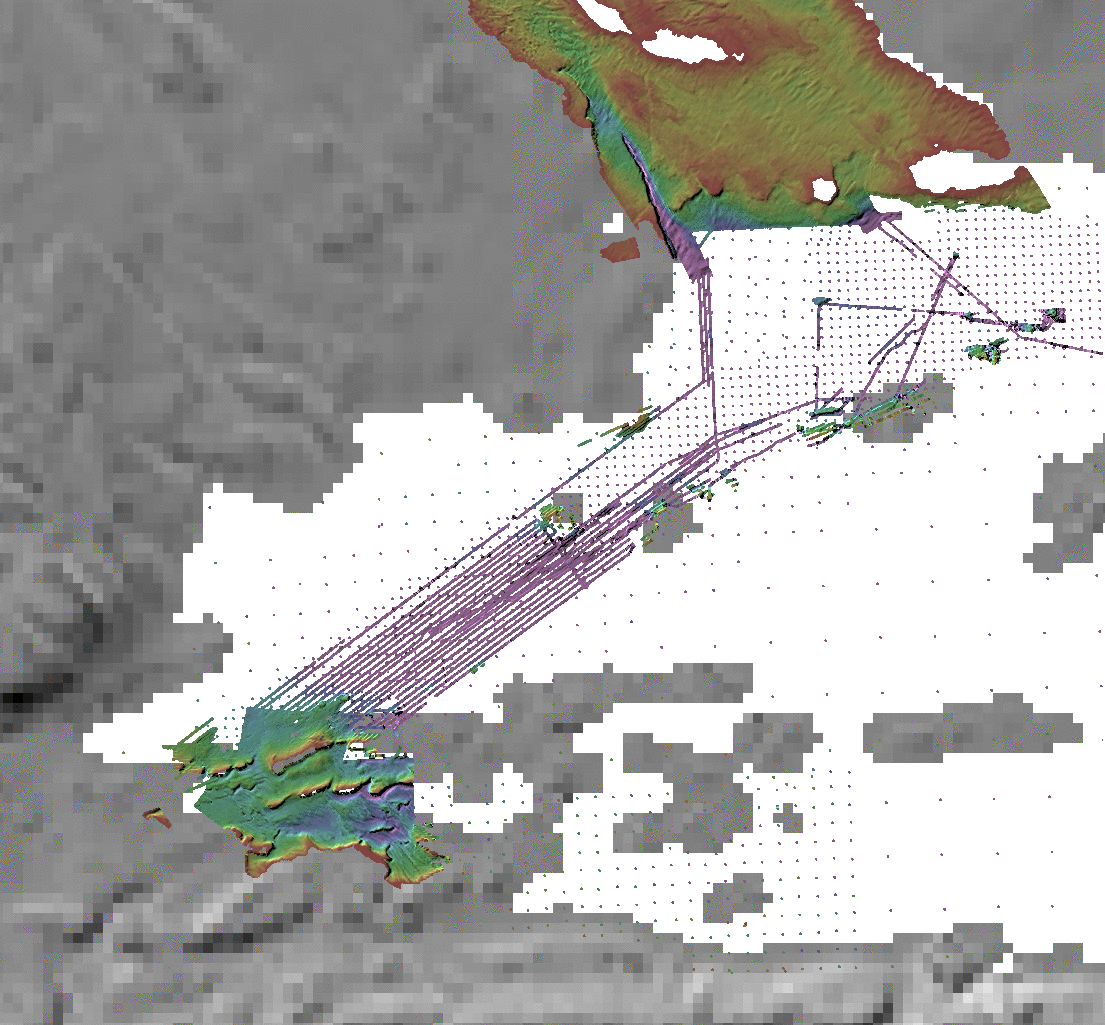
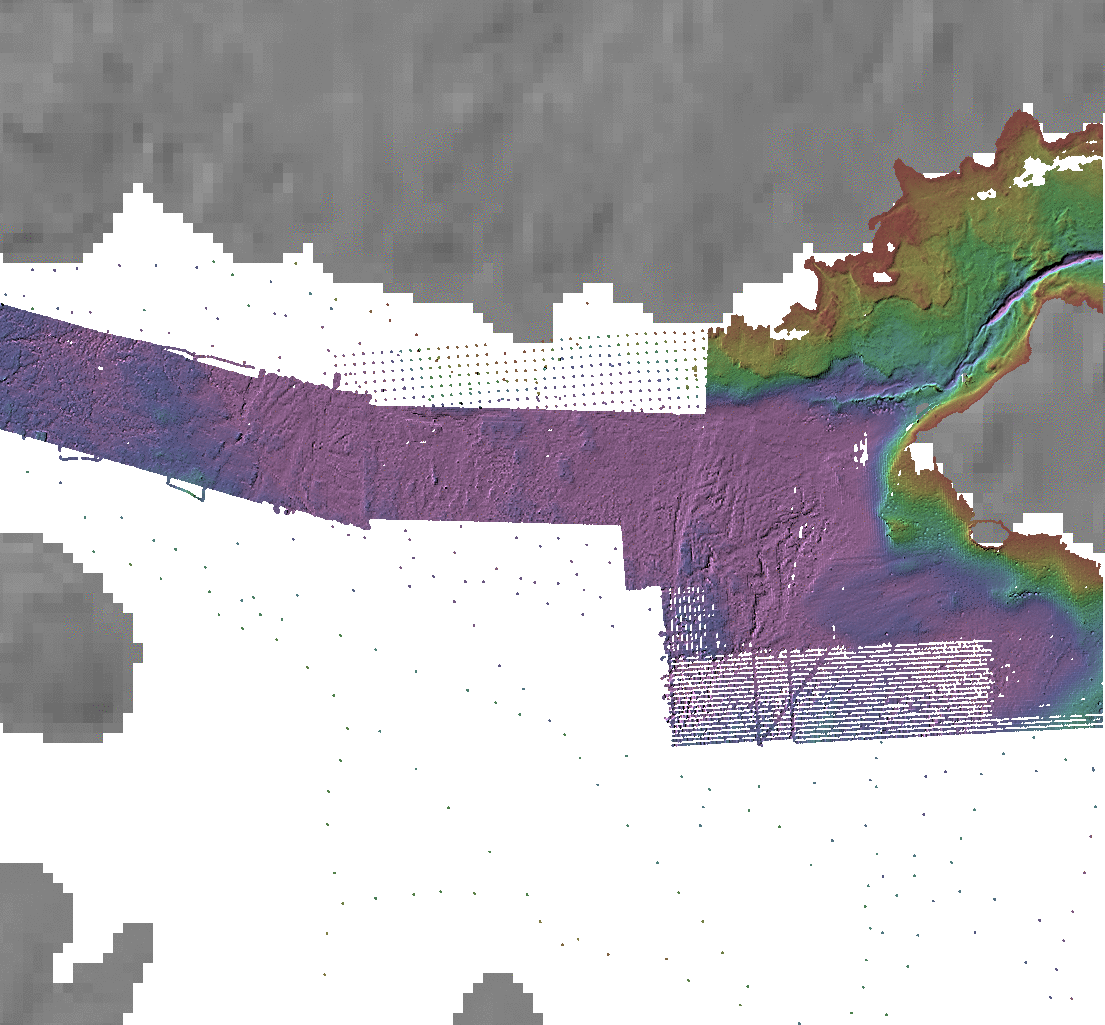
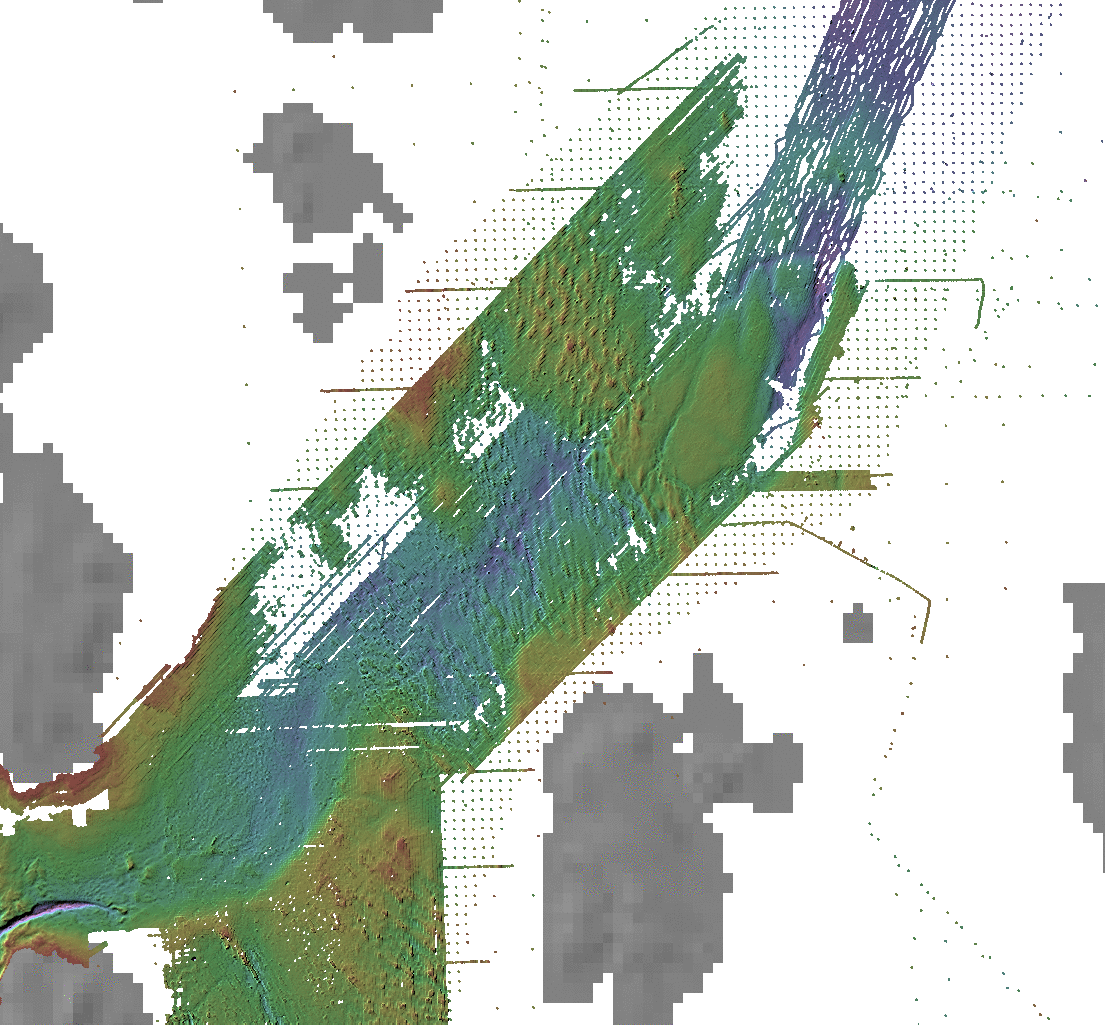
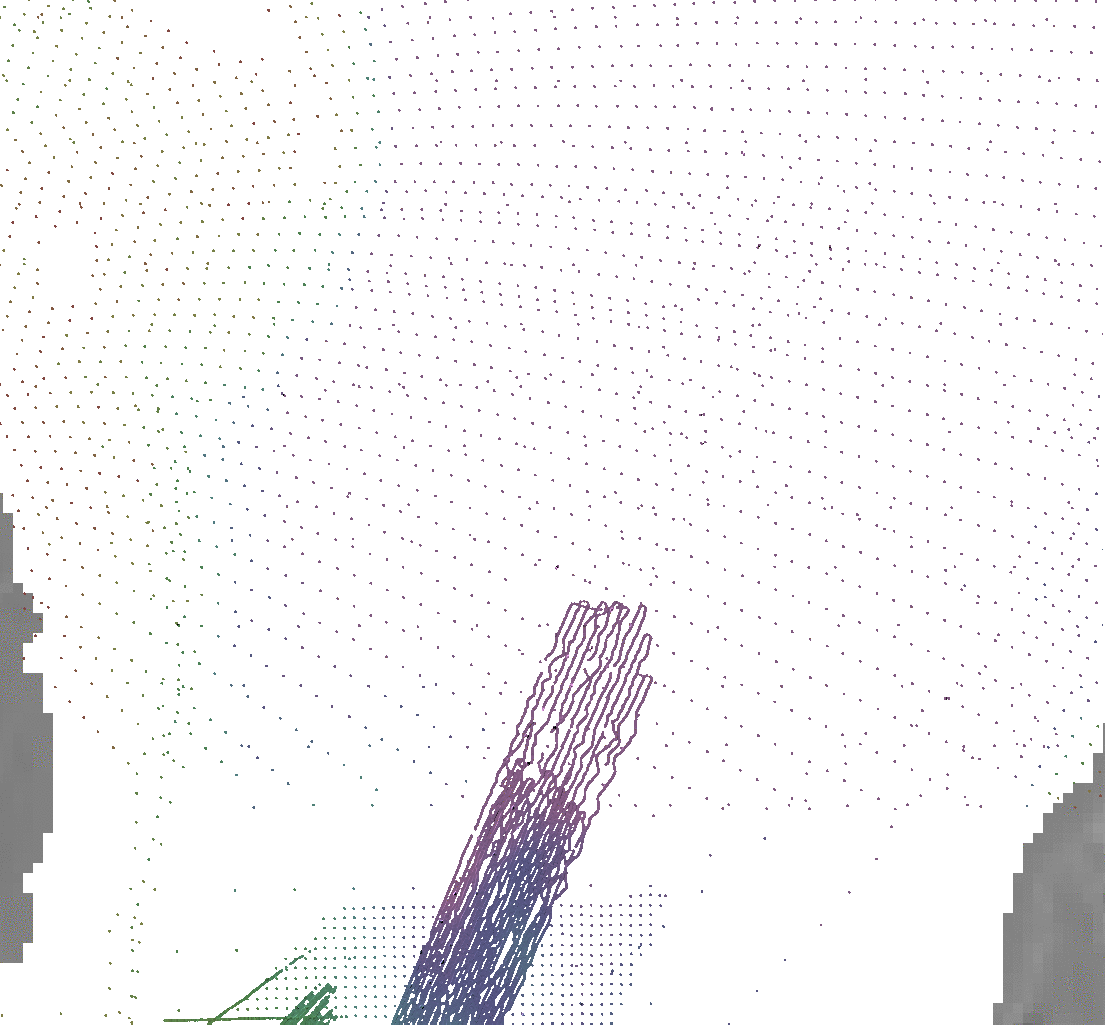
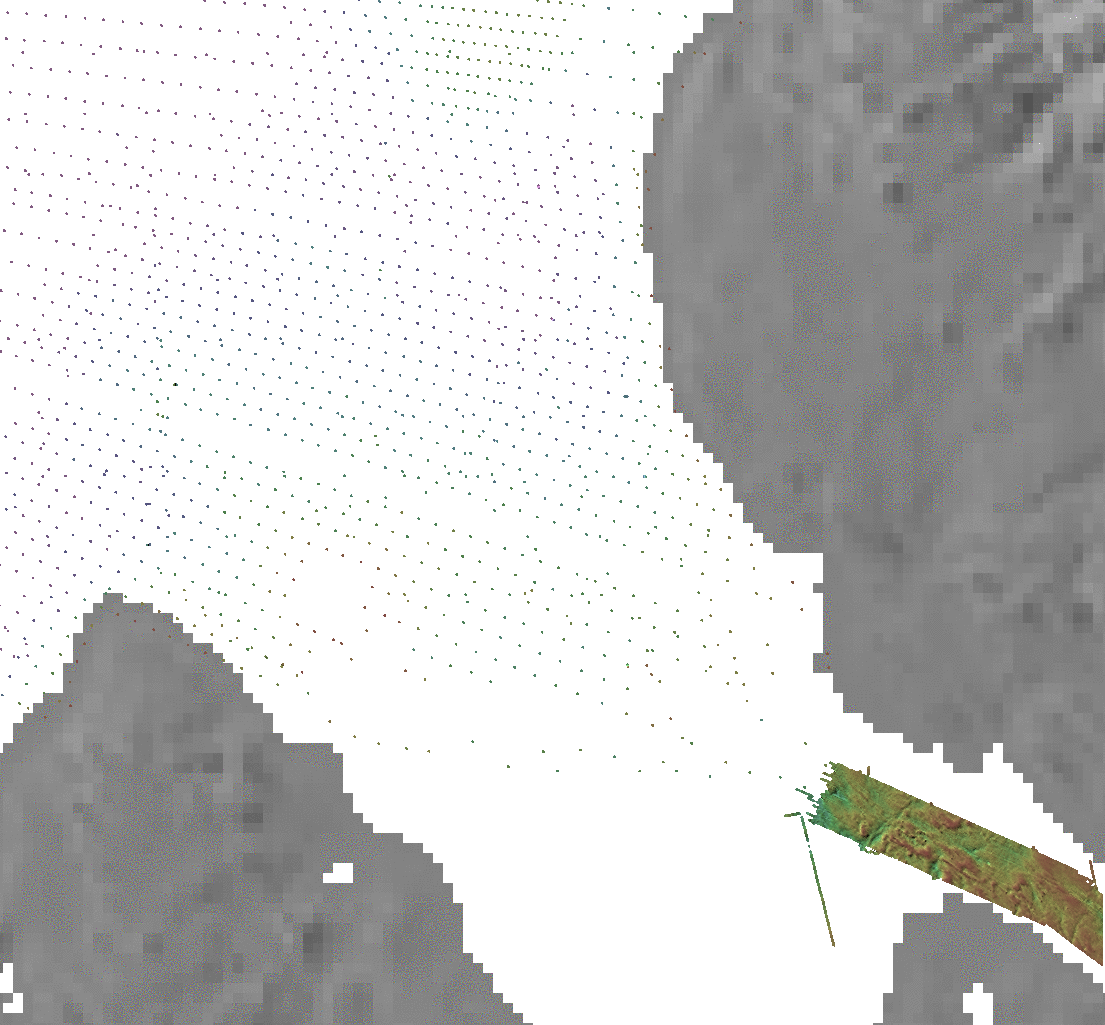
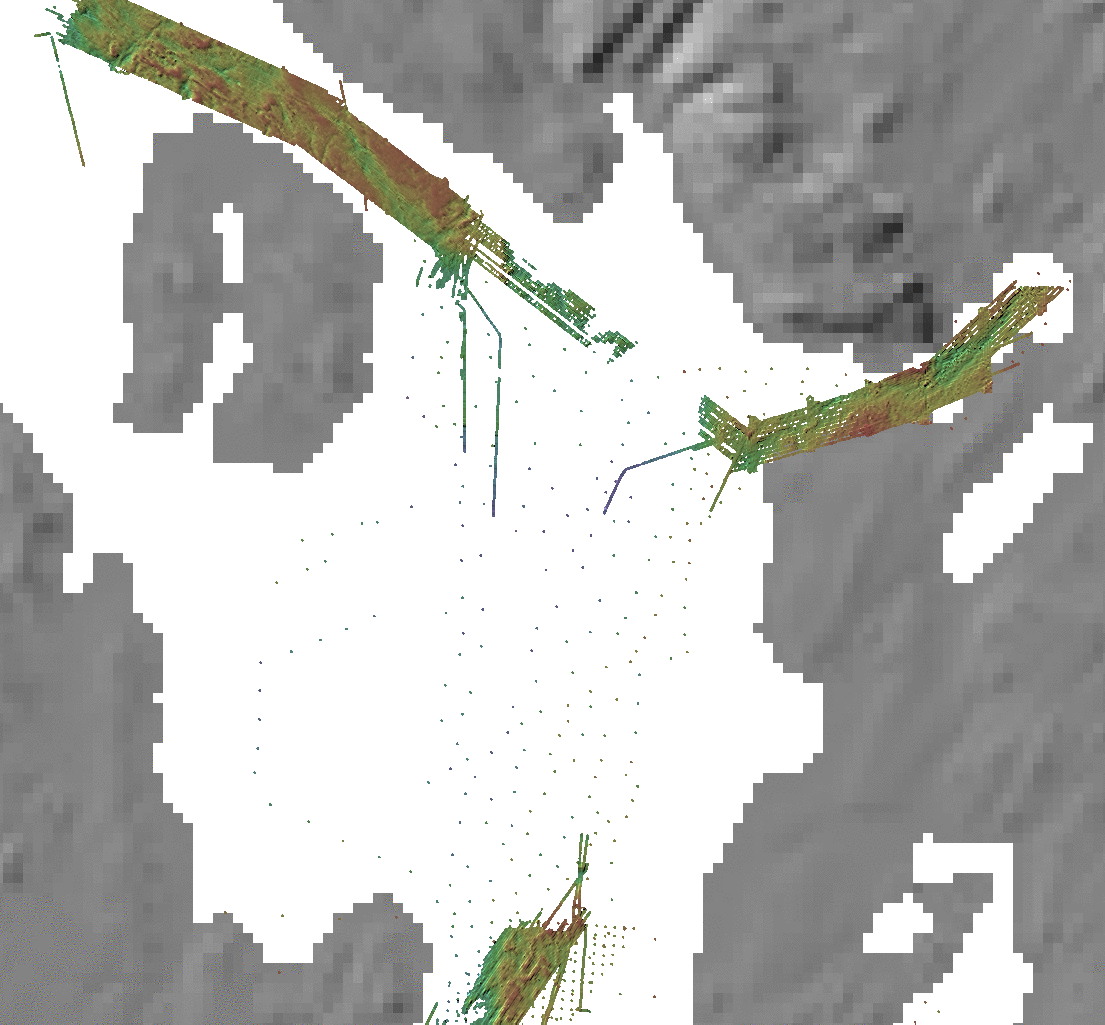
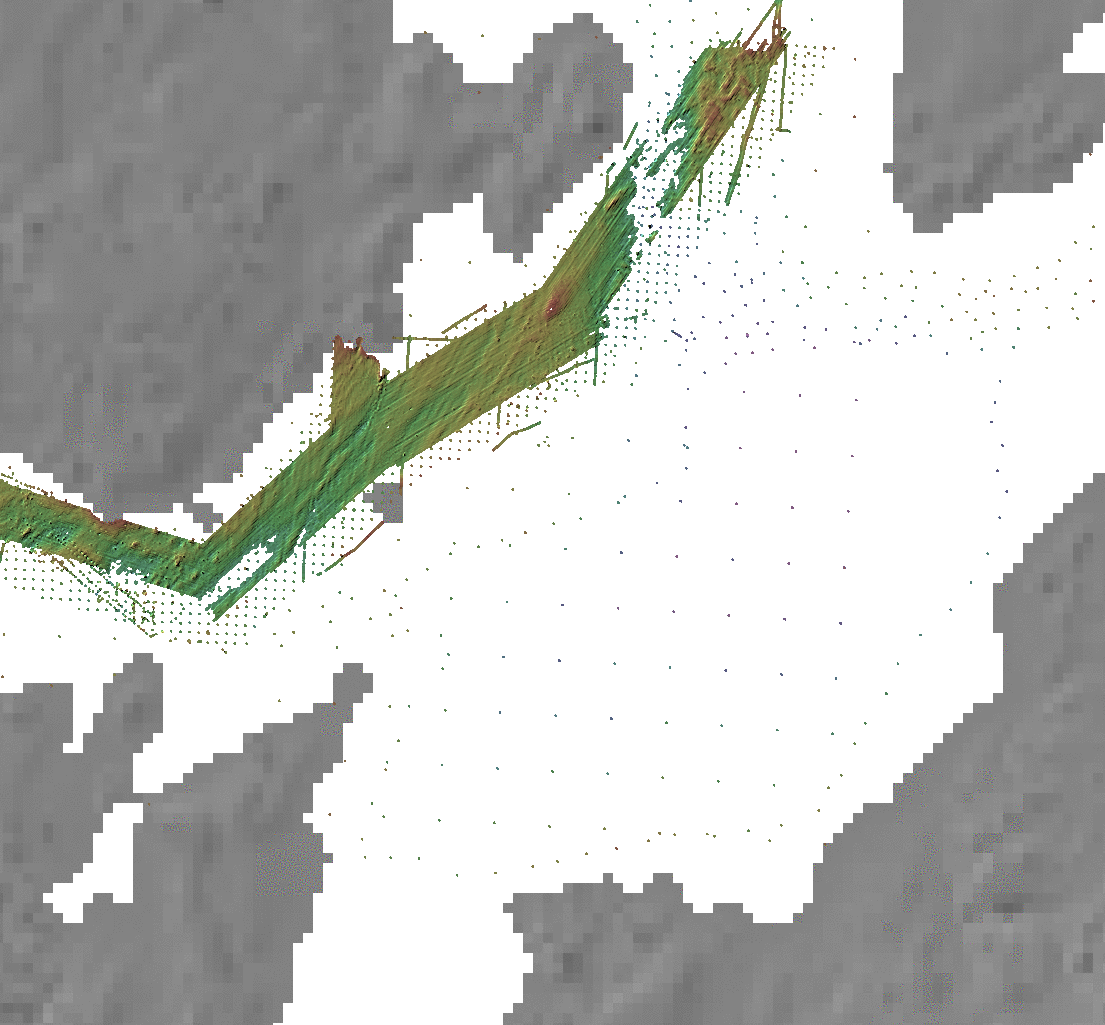
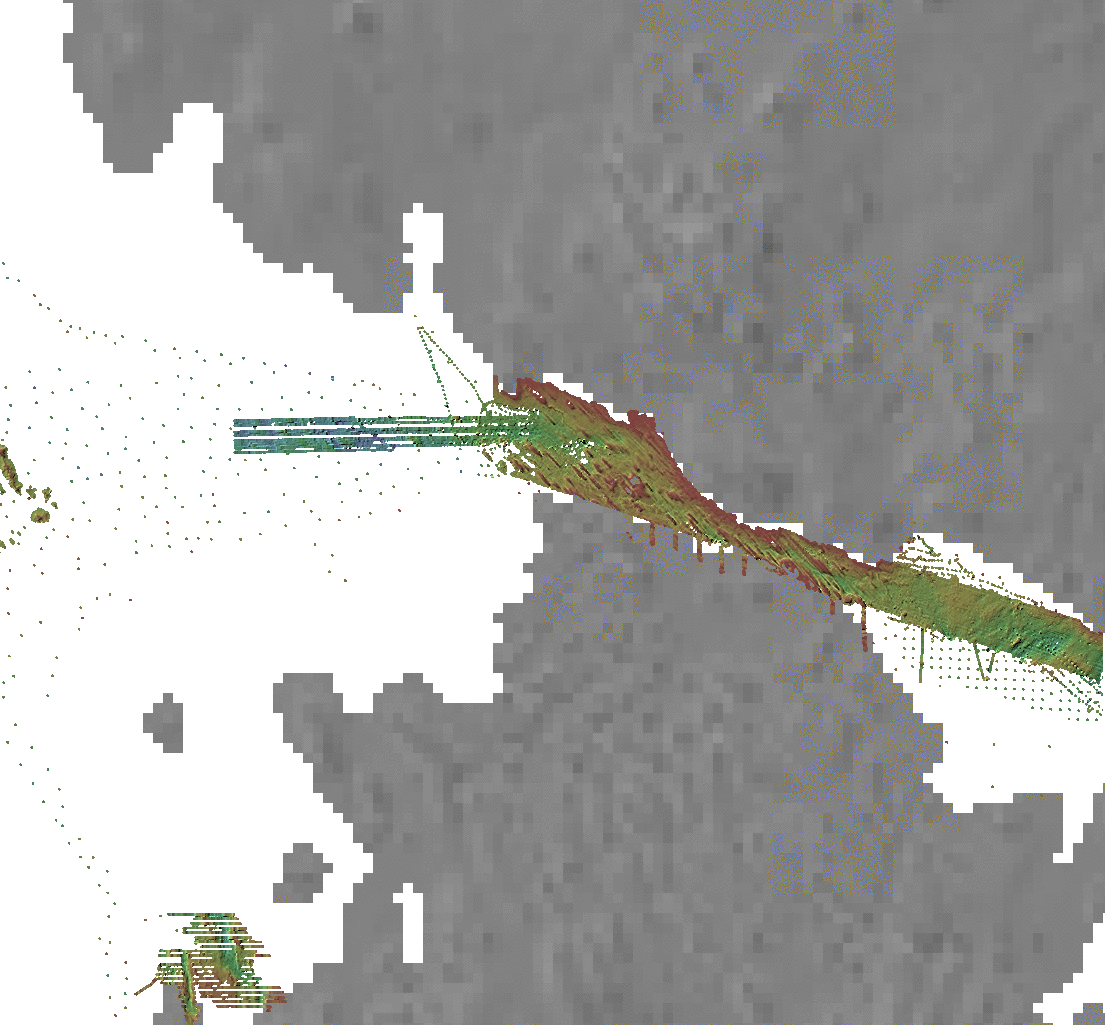
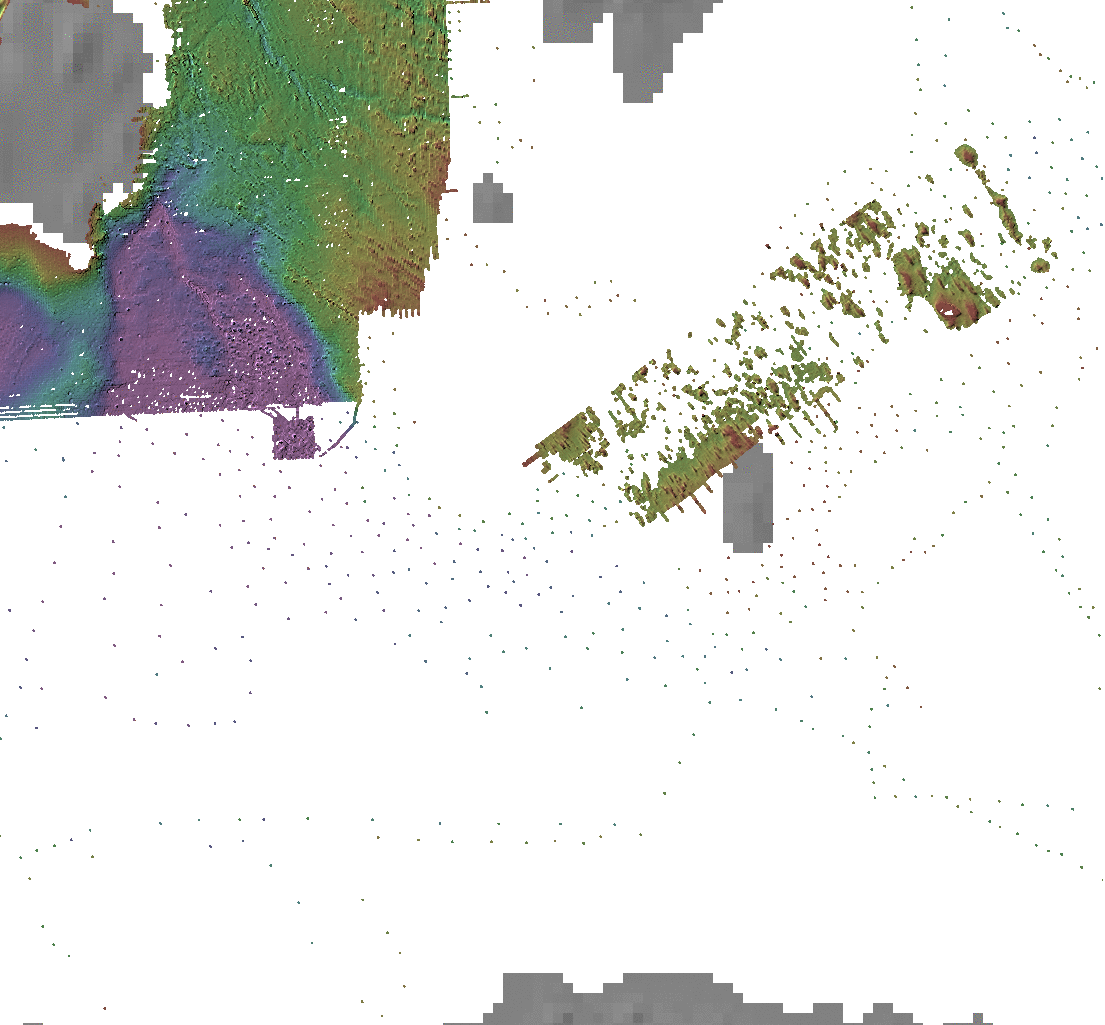
If one superimposes the available digital source CHS data at scales of 1-2 km's (fig to left) it would appear that the digital archives in the critical shipping corridor region exhibit near complete coverage. One has to bear in mind, however, the scale of these surveys. They include:
- ~ 6000m spacing sparse through ice samples.
- ~ 1000m spacing denser through ice samples.
- TIBS (electromagnetic) and/or Larsen 500 (laser) solutions (max depth ~ 40m)
- ~ 300m spacing regional systematic acoustic single beam surveys.
- ~ 100m spacing denser acoustic single surveys in critical choke-points or over sills.
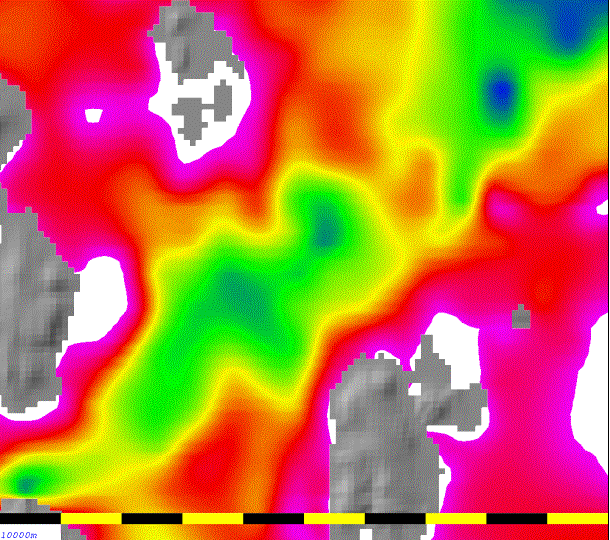
Depending on the density of the data, significant insights into the regional geomorphology can be obtained from this data down to wavelengths as short as ~ 200m. In order to present this data in a more useful way (CHS sounding sheets are conventional sounding plots that don't well express the morphology), I have generated a series of ~100 x 100 km images at 100m pixel size that (with slight interpolation) reveal the geomorphology of the Passage (presented below).